Proceedings of the Twenty-Fifth AAAI Conference on Artificial Intelligence
An Empirical Study of Bagging Predictors for Different Learning Algorithms
Guohua Liang, Xingquan Zhu, and Chengqi Zhang
The Centre for Quantum Computation & Intelligent Systems, FEIT, University of Technology, Sydney, NSW 2007, Australia
{gliang, xqzhu, chengqi}@it.uts.edu.au
predictor to outperform a single learner? Answering these
questions poses the following research challenges: (1) how
to classify the base learners into different categories, and (2)
how to conduct a fair and rigorous study to evaluate
multiple algorithms over multiple data-sets (Demšar 2006).
Abstract
Bagging is a simple, yet effective design which combines
multiple base learners to form an ensemble for prediction.
Despite its popular usage in many real-world applications,
existing research is mainly concerned with studying
unstable learners as the key to ensure the performance gain
of a bagging predictor, with many key factors remaining
unclear. For example, it is not clear when a bagging
predictor can outperform a single learner and what is the
expected performance gain when different learning
algorithms were used to form a bagging predictor. In this
paper, we carry out comprehensive empirical studies to
evaluate bagging predictors by using 12 different learning
algorithms and 48 benchmark data-sets. Our analysis uses
robustness and stability decompositions to characterize
different learning algorithms, through which we rank all
learning algorithms and comparatively study their bagging
predictors to draw conclusions. Our studies assert that both
stability and robustness are key requirements to ensure the
high performance for building a bagging predictor. In
addition, our studies demonstrated that bagging is
statistically superior to most single learners, except for KNN
and Naïve Bayes (NB). Multi-layer perception (MLP),
Naïve Bayes Trees (NBTree), and PART are the learning
algorithms with the best bagging performance.
Designed Framework
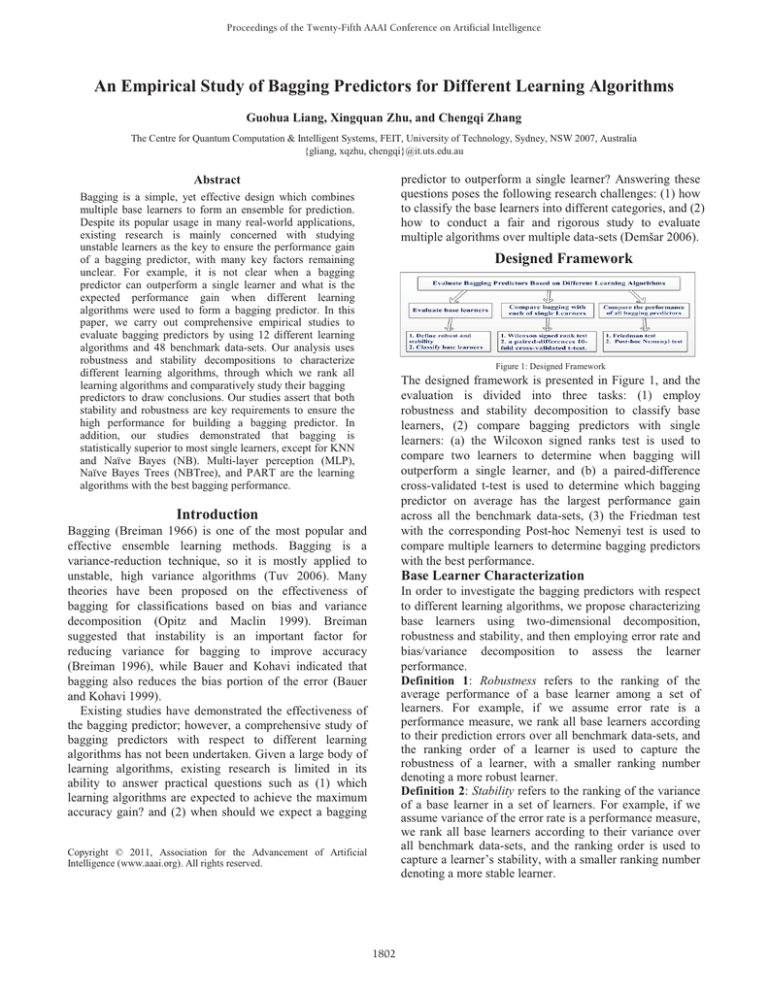
Figure 1: Designed Framework
The designed framework is presented in Figure 1, and the
evaluation is divided into three tasks: (1) employ
robustness and stability decomposition to classify base
learners, (2) compare bagging predictors with single
learners: (a) the Wilcoxon signed ranks test is used to
compare two learners to determine when bagging will
outperform a single learner, and (b) a paired-difference
cross-validated t-test is used to determine which bagging
predictor on average has the largest performance gain
across all the benchmark data-sets, (3) the Friedman test
with the corresponding Post-hoc Nemenyi test is used to
compare multiple learners to determine bagging predictors
with the best performance.
Introduction
Bagging (Breiman 1966) is one of the most popular and
effective ensemble learning methods. Bagging is a
variance-reduction technique, so it is mostly applied to
unstable, high variance algorithms (Tuv 2006). Many
theories have been proposed on the effectiveness of
bagging for classifications based on bias and variance
decomposition (Opitz and Maclin 1999). Breiman
suggested that instability is an important factor for
reducing variance for bagging to improve accuracy
(Breiman 1996), while Bauer and Kohavi indicated that
bagging also reduces the bias portion of the error (Bauer
and Kohavi 1999).
Existing studies have demonstrated the effectiveness of
the bagging predictor; however, a comprehensive study of
bagging predictors with respect to different learning
algorithms has not been undertaken. Given a large body of
learning algorithms, existing research is limited in its
ability to answer practical questions such as (1) which
learning algorithms are expected to achieve the maximum
accuracy gain? and (2) when should we expect a bagging
Base Learner Characterization
In order to investigate the bagging predictors with respect
to different learning algorithms, we propose characterizing
base learners using two-dimensional decomposition,
robustness and stability, and then employing error rate and
bias/variance decomposition to assess the learner
performance.
Definition 1: Robustness refers to the ranking of the
average performance of a base learner among a set of
learners. For example, if we assume error rate is a
performance measure, we rank all base learners according
to their prediction errors over all benchmark data-sets, and
the ranking order of a learner is used to capture the
robustness of a learner, with a smaller ranking number
denoting a more robust learner.
Definition 2: Stability refers to the ranking of the variance
of a base learner in a set of learners. For example, if we
assume variance of the error rate is a performance measure,
we rank all base learners according to their variance over
all benchmark data-sets, and the ranking order is used to
capture a learner’s stability, with a smaller ranking number
denoting a more stable learner.
Copyright © 2011, Association for the Advancement of Artificial
Intelligence (www.aaai.org). All rights reserved.
1802
Averaged Improvement of Bagging on
Multiple Data-Sets
0/1 Loss Instance Basi & Variance
Improved Average Error Rate
0.08
1.0
0.07
RdTree
0.9
0.06
Stable --------------Unstable
0.8
0.05
DTable
0.7
PART
0.6
0.04
RepTree
0.03
OneR
NBTree
0.5
0.02
J48
0.01
0.4
DStump
0.00
0.3
0.2 0.3 0.4 0.5 0.6 0.7 0.8
Strong ------------------------Weak
0.9
1.0
PART
J48
DTable
OneR
RandTree
0.1
RepTree
0.0
Figure 2: Two dimensional decomposition of
the base learner, where x-axis denotes the strong
vs. weak characterization of the base learners,
and y-axis denotes the stable vs. unstable ability
of the base learners.
NBTree
NB
MLP
SVM
0.0
DStump
MLP
0.1
NB
KNN
SVM
0.2
KNN
-0.01
Figure 4: Comparison of all Bagging predictors from Friedman and Post-hoc
Nemenyi test, where x-axes indicate the mean rank of each algorithm, the y axes
indicate the ascending ranking order of the Bagging predictors and the horizontal
error bars indicate the “critical difference”. The performance of two bagging
predictors is significantly different when the horizontal bars are not overlapping.
Figure 3: The improved accuracy between
bagging predictors and individual base
learners on average over multiple data-sets.
The error bars present a 95% confidence
interval based on the cross-validated t test.
Figure 2 demonstrates the Robustness vs. Stability
decomposition in assessing base learners based on 0/1 loss
instance bias and variance as a performance measure. The
average ranks of bias and variance were obtained as
ranking orders of the robustness and stability of base
learners. Normalized ascending rank orders of robustness
and stability were calculated for two-dimensional plotting.
MLP and SVM with a smaller value of robustness denote a
more robust learner, while NB and SVM with a smaller
value of stability denote more stable learners.
Learners
p-values
Learners
p-values
Bagging against Single Learners on Wilcoxon Signed Rank test
NB
KNN
SVM
MLP
DStump
.001
.000
.000
.555
.110
DTable
.000
OneR
.000
J48
.000
PART
.000
RepTree
.000
NBTree
.000
RdTree
.000
Table 1: The significance level is .05. The Null Hypothesis is that the median of
differences between Bagging and each single learner equals 0. Rule: Reject the Null
Hypothesis if the p-YDOXH7HVW6WDWLVWLF:LVOHVVWKDQĮ DWthe 95% confidence
level of significance.
Figure 4 reports the results of the Friedman with Posthoc Nemenyi test for comparison of all bagging predictors’
average ranks on 48 data-sets. The group of most robust
base learners, MLP, NBTree, and PART contribute to the
best bagging predictors; whereas the group of weakest
learners, OneR and DStump lead to the worst bagging
predictors. There is a statistically significant difference
between the two groups. As a result, one can conclude that
the robustness of the base learners is an important factor
for building accurate bagging predictors.
Experimental Results
We use WEKA implementation of the 12 algorithms with
default parameters settings in this empirical study (Witten
and Frank 2005). In order to reduce uncertainty and obtain
reliable experimental results, all the evaluations are
assessed under the same test conditions by using the same
randomly selected bootstrap samples with replacements in
each fold of 10-trial 10-folds cross-validation on each of 48
data-sets.
In Figure 2 we observe that MLP and Support Vector
Machines (SVM), both having relatively lower variance,
are similar to, and have more robustness than KNN and NB,
respectively.
Figure 3 demonstrates that bagging RandTree (RdTree)
gains nearly 6% improvement in Error Rate on average
over 48 data-sets, while there is almost no gain for bagging
NB and KNN. These findings are consistent with
Breiman’s theories. However, bagging MLP and SVM
receive better performance gain than bagging KNN and
NB over 48 data-sets. According to Breiman’s theories, if
they have similar variance with KNN and NB, respectively,
they are not supposed to have a better gain than KNN and
NB. A possible reason is that both MLP and SVM are
stronger than KNN and NB.
Table 1 Wilcoxon Signed Rank Test indicates that
bagging performs better than most of the single learners,
except for KNN and NB. Previous studies have concluded
that KNN and NB are stable learners, so their performance
in bagging predictors is not supposed to be good.
Conclusions
This paper empirically studies the bagging predictors with
respect to different types of base learners, by using
robustness and stability decomposition and a number of
statistical tests. Our observations conclude that the most
robust base learners such as, MLP, NBTree and PART can
be used to build good bagging predictors.
Acknowledgement
This research is supported by Australian Research Council
Discovery Project (DP1093762) and Future Fellowship
(FT100100971).
References
Bauer, E., and Kohavi, R. 1999. An empirical comparison of voting
classification algorithms: Bagging, boosting, and variants. Machine
learning 36: 105-139.
Breiman, L. 1996. Bagging predictors. Machine learning 24: 123140.
Demšar, J. 2006. Statistical comparisons of classifiers over multiple
data sets. The Journal of Machine Learning Research 7: 1-30.
Opitz, D., and Maclin, R. 1999. Popular ensemble methods: An
empirical study. Journal of Artificial Intelligence Research 11: 169198.
Tuv, E. 2006. Ensemble learning. In Feature Extraction 207: 187–
204 of Studies in Fuzziness and Soft Computing. Springer Berlin /
Heidelberg.
Witten, I. H., and Frank, E. 2005. Data Mining: Practical Machine
Learning Tools and Techniques, Second Edition. Morgan Kaufmann.
1803


