LEVICH-KOUTECKY ANALYSIS
advertisement
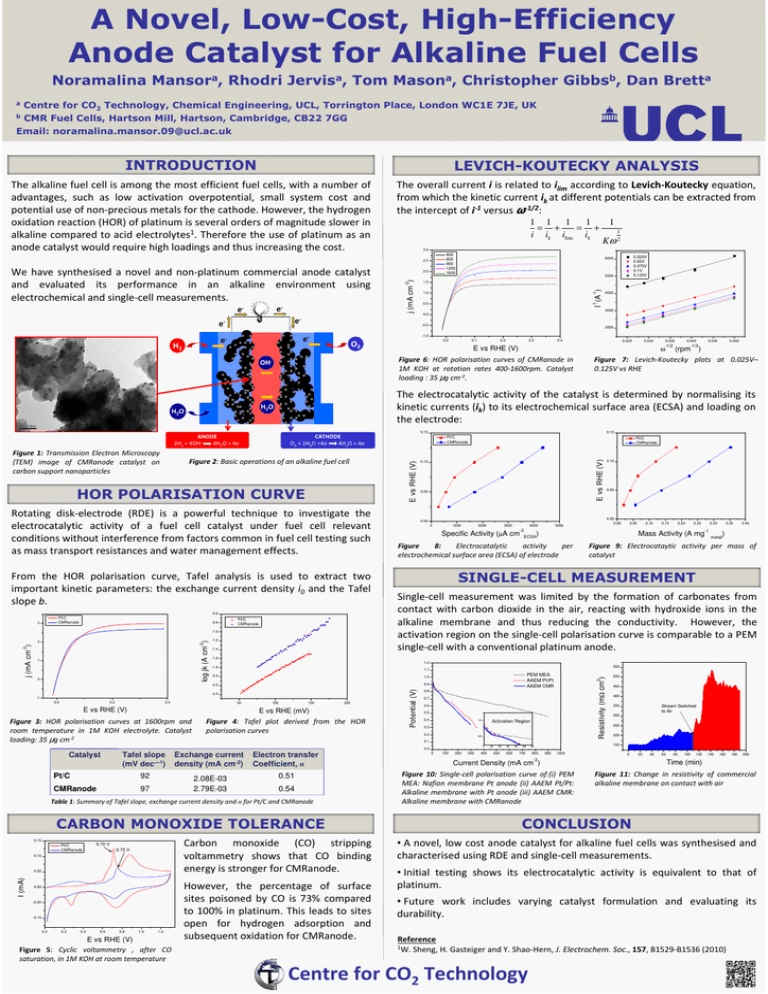
A Novel, Low-Cost, High-Efficiency Anode Catalyst for Alkaline Fuel Cells Noramalina Mansora, Rhodri Jervisa, Tom Masona, Christopher Gibbsb, Dan Bretta a Centre for CO2 Technology, Chemical Engineering, UCL, Torrington Place, London WC1E 7JE, UK CMR Fuel Cells, Hartson Mill, Hartson, Cambridge, CB22 7GG Email: noramalina.mansor.09@ucl.ac.uk b INTRODUCTION LEVICH-KOUTECKY ANALYSIS The alkaline fuel cell is among the most efficient fuel cells, with a number of advantages, such as low activation overpotential, small system cost and potential use of non-precious metals for the cathode. However, the hydrogen oxidation reaction (HOR) of platinum is several orders of magnitude slower in alkaline compared to acid electrolytes1. Therefore the use of platinum as an anode catalyst would require high loadings and thus increasing the cost. The overall current i is related to ilim according to Levich-Koutecky equation, from which the kinetic current ik at different potentials can be extracted from the intercept of i-1 versus ω-1/2: 1 1 1 1 1 = + = + 1 i ik ilim ik Kω 2 3.0 400 600 900 1200 1600 2.5 1.0 -1 0.5 -1 4000 3000 0.0 2000 -1.0 0.0 O2 0.1 0.2 0.3 0.4 0.025 Rotating disk-electrode (RDE) is a powerful technique to investigate the electrocatalytic activity of a fuel cell catalyst under fuel cell relevant conditions without interference from factors common in fuel cell testing such as mass transport resistances and water management effects. From the HOR polarisation curve, Tafel analysis is used to extract two important kinetic parameters: the exchange current density i0 and the Tafel slope b. -0.6 -0.8 Pt/C CMRanode -1.0 -1.2 -2 E vs RHE (V) 1000 2000 50 100 150 200 Figure 4: Tafel plot derived from the HOR polarisation curves 92 97 2.08E-03 2.79E-03 0.51 CMRanode 0.54 Table 1: Summary of Tafel slope, exchange current density and α for Pt/C and CMRanode CARBON MONOXIDE TOLERANCE Carbon monoxide (CO) stripping voltammetry shows that CO binding energy is stronger for CMRanode. I (mA) 0.00 -0.05 -0.10 0.0 0.2 0.4 0.6 0.8 1.0 1.2 E vs RHE (V) Figure 5: Cyclic voltammetry , after CO saturation, in 1M KOH at room temperature 0.25 0.30 0.35 0.40 ) metal Figure 9: Electrocataytic activity per mass of catalyst 550 PEM MEA AAEM Pt/Pt AAEM CMR 0.8 0.7 0.6 0.5 0.4 1.0 Activation Region 0.3 0.2 0.8 0.1 Pt/C 0.05 0.20 Single-cell measurement was limited by the formation of carbonates from contact with carbon dioxide in the air, reacting with hydroxide ions in the alkaline membrane and thus reducing the conductivity. However, the activation region on the single-cell polarisation curve is comparable to a PEM single-cell with a conventional platinum anode. 0.9 Electron transfer Coefficient, α 0.75 V 0.15 SINGLE-CELL MEASUREMENT -2.2 Exchange current density (mA cm-2) 0.70 V 0.10 -1 Figure 8: Electrocatalytic activity per electrochemical surface area (ECSA) of electrode 1.0 Tafel slope (mV dec—1) Pt/C CMRanode 0.05 Mass Activity (A mg 1.1 E vs RHE (mV) 0.10 0.00 0.00 5000 ) ECSA 1.2 0.4 0.15 4000 0.05 -2 0 0.0 Catalyst 3000 Specific Activity (µA cm -2.0 E vs RHE (V) Figure 3: HOR polarisation curves at 1600rpm and room temperature in 1M KOH electrolyte. Catalyst loading: 35 µg cm-2 0 -1.8 -2.4 0.2 0.05 0.10 -1.6 -1 0.0 0.050 However, the percentage of surface sites poisoned by CO is 73% compared to 100% in platinum. This leads to sites open for hydrogen adsorption and subsequent oxidation for CMRanode. 0 100 200 300 400 20 40 500 60 600 80 100 700 450 400 Stream Switched to Air 350 300 250 200 900 1000 0 -2 20 40 60 80 100 120 140 160 180 200 Time (min) Current Density (mA cm ) Figure 10: Single-cell polarisation curve of:(i) PEM MEA: Nafion membrane Pt anode (ii) AAEM Pt/Pt: Alkaline membrane with Pt anode (iii) AAEM CMR: Alkaline membrane with CMRanode Air N2 150 120 800 500 2 0 -1.4 0.10 Resistivity (mΩ cm ) 1 0.045 ) Pt/C CMRanode 0.00 Potential (V) log jk (A cm ) -2 j (mA cm ) 2 Pt/C CMRanode E vs RHE (V) Figure 2: Basic operations of an alkaline fuel cell Pt/C CMRanode -1/2 0.15 CATHODE O2 + 2H2O +4e4H2O + 4e- HOR POLARISATION CURVE 3 0.040 (rpm Figure 7: Levich-Koutecky plots at 0.025V– 0.125V vs RHE 0.15 Figure 1: Transmission Electron Microscopy (TEM) image of CMRanode catalyst on carbon support nanoparticles 0.035 -1/2 ω The electrocatalytic activity of the catalyst is determined by normalising its kinetic currents (ik) to its electrochemical surface area (ECSA) and loading on the electrode: H2O ANODE 2H2 + 4OH4H2O + 4e- 0.030 E vs RHE (V) Figure 6: HOR polarisation curves of CMRanode in 1M KOH at rotation rates 400-1600rpm. Catalyst loading : 35 µg cm-2. OH- H2O 5000 1.5 -0.5 e- e- H2 -2 e- e- 0.025V 0.05V 0.075V 0.1V 0.125V 6000 I (A ) e- e- j (mA cm ) We have synthesised a novel and non-platinum commercial anode catalyst and evaluated its performance in an alkaline environment using electrochemical and single-cell measurements. 2.0 Figure 11: Change in resistivity of commercial alkaline membrane on contact with air CONCLUSION • A novel, low cost anode catalyst for alkaline fuel cells was synthesised and characterised using RDE and single-cell measurements. • Initial testing shows its electrocatalytic activity is equivalent to that of platinum. • Future work includes varying catalyst formulation and evaluating its durability. Reference 1W. Sheng, H. Gasteiger and Y. Shao-Hern, J. Electrochem. Soc., 157, B1529-B1536 (2010) Centre for CO2 Technology
