Regional Breakdown Looking at the Whole Campaign CPAC-SES Nightly Tracking
advertisement
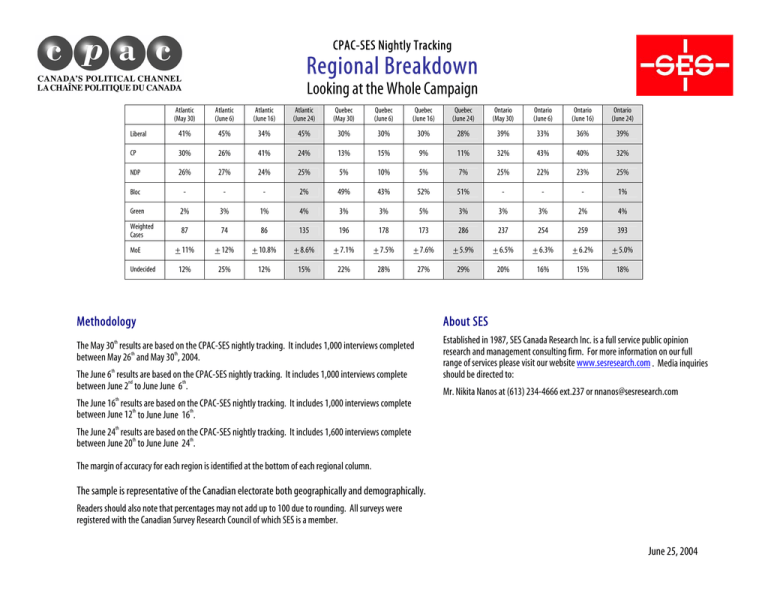
CPAC-SES Nightly Tracking Regional Breakdown Looking at the Whole Campaign Atlantic (May 30) Atlantic (June 6) Atlantic (June 16) Atlantic (June 24) Quebec (May 30) Quebec (June 6) Quebec (June 16) Quebec (June 24) Ontario (May 30) Ontario (June 6) Ontario (June 16) Ontario (June 24) Liberal 41% 45% 34% 45% 30% 30% 30% 28% 39% 33% 36% 39% CP 30% 26% 41% 24% 13% 15% 9% 11% 32% 43% 40% 32% NDP 26% 27% 24% 25% 5% 10% 5% 7% 25% 22% 23% 25% Bloc - - - 2% 49% 43% 52% 51% - - - 1% Green 2% 3% 1% 4% 3% 3% 5% 3% 3% 3% 2% 4% Weighted Cases 87 74 86 135 196 178 173 286 237 254 259 393 + 11% + 12% + 10.8% + 8.6% + 7.1% + 7.5% + 7.6% + 5.9% + 6.5% + 6.3% + 6.2% + 5.0% 12% 25% 12% 15% 22% 28% 27% 29% 20% 16% 15% 18% MoE Undecided Methodology th The May 30 results are based on the CPAC-SES nightly tracking. It includes 1,000 interviews completed th th between May 26 and May 30 , 2004. th The June 6 results are based on the CPAC-SES nightly tracking. It includes 1,000 interviews complete nd th between June 2 to June June 6 . About SES Established in 1987, SES Canada Research Inc. is a full service public opinion research and management consulting firm. For more information on our full range of services please visit our website www.sesresearch.com . Media inquiries should be directed to: Mr. Nikita Nanos at (613) 234-4666 ext.237 or nnanos@sesresearch.com th The June 16 results are based on the CPAC-SES nightly tracking. It includes 1,000 interviews complete th th between June 12 to June June 16 . th The June 24 results are based on the CPAC-SES nightly tracking. It includes 1,600 interviews complete th th between June 20 to June June 24 . The margin of accuracy for each region is identified at the bottom of each regional column. The sample is representative of the Canadian electorate both geographically and demographically. Readers should also note that percentages may not add up to 100 due to rounding. All surveys were registered with the Canadian Survey Research Council of which SES is a member. June 25, 2004 CPAC-SES Nightly Tracking Regional Breakdown Looking at the Whole Campaign MB/SK (May 30) MB/SK (June 6) MB/SK (June 16) MB/SK (June 24) Alberta (May 30) Alberta (June 6) Alberta (June 16) Alberta (June 24) BC (May 30) BC (June 6) BC (June 16) BC (June 24) Liberal 41% 35% 32% 39% 31% 33% 32% 23% 34% 31% 27% 28% CP 35% 42% 32% 34% 53% 51% 51% 62% 29% 37% 35% 38% NDP 23% 20% 30% 24% 11% 14% 14% 13% 29% 26% 25% 28% Bloc - - 1% 1% - - - - - - 3% - Green 1% 4% 6% 2% 5% 2% 5% 2% 8% 5% 10% 6% Weighted Cases 79 77 89 137 81 88 89 145 121 118 135 192 + 11% + 11.4% + 10.6% + 8.5% + 11% + 10.7% + 10.6% + 8.3% + 9.1% + 9.2% + 8.7% + 7.2% 22% 24% 13% 14% 22% 13% 11% 10% 19% 21% 16% 19% MoE Undecided Methodology th The May 30 results are based on the CPAC-SES nightly tracking. It includes 1,000 interviews completed th th between May 26 and May 30 , 2004. th The June 6 results are based on the CPAC-SES nightly tracking. It includes 1,000 interviews complete nd th between June 2 to June June 6 . About SES Established in 1987, SES Canada Research Inc. is a full service public opinion research and management consulting firm. For more information on our full range of services please visit our website www.sesresearch.com . Media inquiries should be directed to: Mr. Nikita Nanos at (613) 234-4666 ext.237 or nnanos@sesresearch.com th The June 16 results are based on the CPAC-SES nightly tracking. It includes 1,000 interviews complete th th between June 12 to June June 16 . th The June 24 results are based on the CPAC-SES nightly tracking. It includes 1,600 interviews complete th th between June 20 to June June 24 . The margin of accuracy for each region is identified at the bottom of each regional column. The sample is representative of the Canadian electorate both geographically and demographically. Readers should also note that percentages may not add up to 100 due to rounding. All surveys were registered with the Canadian Survey Research Council of which SES is a member. June 25, 2004

![[#PALLADIO-222] Automatically deriving the optimization problem](http://s3.studylib.net/store/data/007480371_1-e23cf3b38fdfe320514260fd192de951-300x300.png)
