From: AAAI Technical Report SS-92-02. Compilation copyright © 1992, AAAI (www.aaai.org). All rights reserved.
QUALITATIVE
Tim Menzies,
COMPARTMENTAL MODELLING
Paul Compton, Bart Feldman,
Thomas Toth
Artificial
University
Intelligence Lab, University of NewSouth Wales, Australia
School of Computer Science and Engineering,
of New South Wales, P.O. Box 1, Kensington, NSW,Australia,
2033.
{timmlcompton}@spectrum.cs.unsw.oz.au.
ABSTRACT:We describe software to support experimentation with qualitative
models of human physiology. Our knowledge bases are not so much "fonts of
wisdom" that can not be doubted, hut hypothesis that
are under active review. An important feature of our
system is its graphical ability to allow the users to
directly-manipulate
their qualitative
descriptions of
the domain.
K~%qORDS:Qualitative
modelling, hypothesis testing, knowledge acquisition, knowledge representation,
causality, explanation.
1.
INTRODUCTION
Modern technology has been extraordinarily
successful in producing experimental
results.
In their
current form, this mountain of published material is
"dead" knowledge. For example, ifa researcher in Britian publishes a paper that describes a model that
subtly disagrees with a publication from Argentina,
we have no rigorous method for automatically detecting the inconsistency.
¯ Compartment
nodesfor bloodglucoseand insulin.
¯ A structure
fortissues,
kidney,
pancreas,
and liver.
The structures
are sourcesand sinksfor flowsof
materialand are essentiallyconnectionsto the
worldbeyondthe model.
To the standardformalism,
we have introduced
a new
type of node:fact nodes.Sourcesand sinksare connectionsto the outsideworldin termsof flows of
materialwhilefactsare connections
to the outside
worldin termsif it influenceson the model.Generally,
factswillreferto theeffects
of experimental
treatments,
or the effectof a givendrug etc. Their
essential
featureis thattheyreferto physiological
effectsabout which little is known. Our system
assigns
factsa boolean
status.
Theinfluence
of a false
factis ignoredin the model.The influence
of a true
factis usedin thereasoning.
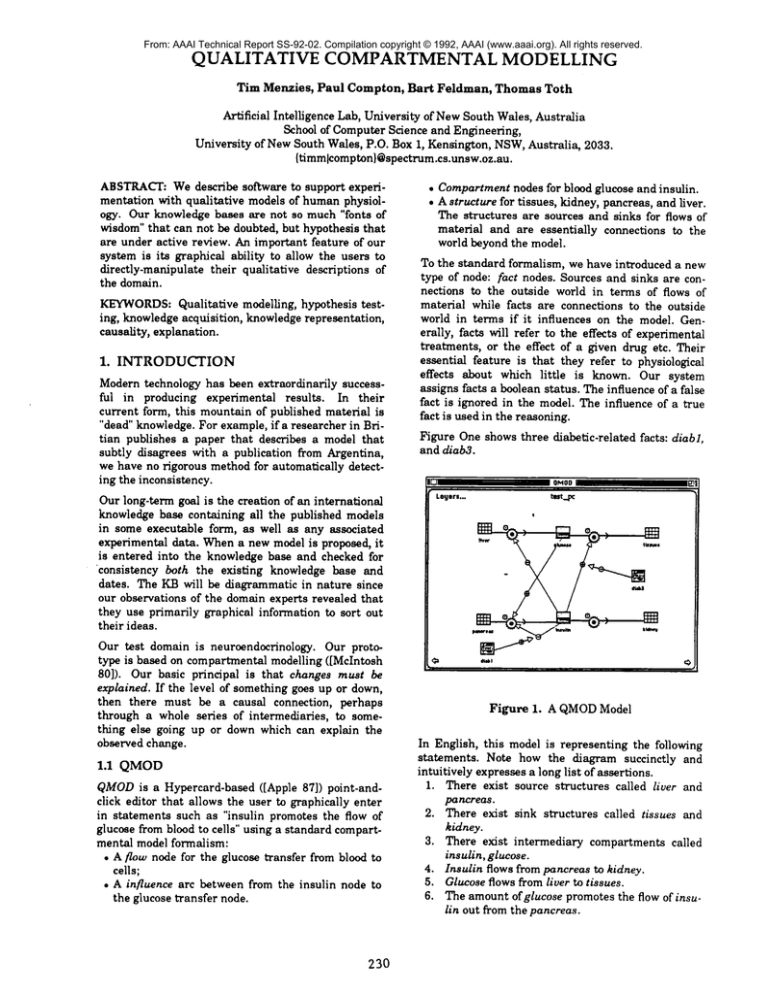
FigureOne showsthreediabetic-related
facts:diabl,
and diab3.
Our long-term goal is the creation of an international
knowledge base containing all the published models
in some executable form, as well as any associated
experimental data. When a new model is proposed, it
is entered into the knowledge base and checked for
consistency
both the existing
knowledge base and
dates. The KB will be diagrammatic in nature since
our observations of the domain experts revealed that
they use primarily graphical information to sort out
their ideas.
Our test domain is neurosndocrinology.
Our prototype is based on compartmental modelling ([McIntosh
80]). Our basic principal
is that changes must be
explained. If the level of something goes up or down,
then there must be a causal connection,
perhaps
through a whole series of intermediaries,
to something else going up or down which can explain the
observed change.
1.1
QMOD
QMODis a Hypercard-based ([Apple 87]) point-andclick editor that allows the user to graphically enter
in statements such as "insulin promotes the flow of
glucose from blood to cells" using a standard compartmental model formalism:
¯ A flow node for the glucose transfer from blood to
cells;
¯ A influencearc betweenfrom the insulinnode to
the glucose
transfer
node.
230
Figure I. A QMOD Model
In English,this modelis representing
the following
statements.Note how the diagramsuccinctlyand
intuitively
expresses
a longlistofassertions.
1. Thereexistsourcestructures
calledliverand
pancreas.
2. There exist sink structures
called tissues and
kidney.
3. There exist intermediary
compartments called
insulin, glucose.
4. Insulin flows from pancreas to kidney.
5. Glucose flows from liver to tissues.
6. The amount of glucose promotes the flow of insulin out from the pancreas.
7.
8.
9.
10.
11.
The amount of insulin inhibits the flow of glucose out from the liver.
The amount of insulin inhibits the flow of insulin out from the pancreas.
The amount of insulin promotes the flow of glucose into the tissues.
If d/ab3 is included in the model, it decreases
the effect of assertion [9].
Ifdiabl is included in the model, it increases the
effect of assertion [8].
1.2 Checking
Experimental
Results
Experimental
results
are entered
in via a
spreadsheet.
The columns store data from various
experimental protocols. For each experiment, certain
facts are true.
Figure Two shows experimental
results from three studies of diabetics:
¯ juvenile: diabl was set to true.
¯ maturity: Both diabI and diab3 are set to true.
¯ control: All treatments are false.
one above, this task is quite complex. The JUSTIN
module of QMODautomates this search.
JUSTIN is
written
in a Macintosh version
of UNSW PROLOG
([Sarnmut 83]). JUSTIN views the QMODmodel as a
set of constraints. For each pair of experiments, qualitative descriptors are generated for the comparison of
the values in the same rows. These descriptors
are
then checked against the model. If they can’t be
created given the constraints
in the model, then the
data is termed unresolved.
Figure Three shows a QMODgraphs that displays the
unresolved
data items. Each unresolved
datum is
marked with a black dot. If the user clicks on the dot,
the dot(s) over the related unresolved data winks
and off. For example, clicking over glucose: juvenile
causes the dot maturity in the same group to wink.
The user can adjust the values in the unresolved
columns by clicking on them with a mouse and pulling
the histogram
up or down. This value change is
automatically updated in the spreadsheet.
GllflPll
j~d..
~ JG,venlle
¯ mN,,Tily
iQii
o
F~
Figure2. Resultsfrom threeexperiments.
Figure 3. Automatic detection
Note that it is good experimental practice to have a
control group. This group provides data on the normal behaviour of the population under study. Note
also that the absence of any treatments is not the only
type of control group. The juvenile diabetic group can
be used as a control group for the maturity onset
group. By comparing results
between these two
groups, we can study the effect of d/ab3 uncontaminated by diabl. A comparison of maturity with control does not allow this effect to be separated.
The spreadsheet stores absolute quantities (e.g. the
glucose compartment of the control
group has 5
I. A humanexperimenter
units)
couldmanuallytrace
these valuesthroughthe modeland see whetherany
of theseexperimental
resultsare inconsistent
with
the world.However,evenin smallmodelssuch as the
1. Note that the displayed numbers do not reflect actual
experimental results, but are merely demonstration
values.
1.3 Validation
of inconsistencies.
Studies
A model was built from a summary paper ([Symthe
89]) and then compared against experimental
data
collectedfrom six researchpapers. The summary
model included 27 compartments, 21 flows, 61
influences
andfilled14 screens.
JUSTIN found numerousunresolveddata. The types
of inconsistencies
included
clerical
errorsin translating modelsto the QMOD representation.
Some of the
inconsistencies
weredue to deliberate
simplifications
of the modelby the researcher,
but whichwere in fact
inconsistentwith the data. The most important
resultwas that the norepinephrine
data in hypothyroid rats who had been givena alpha-2adrenegeric
blockercould not be explained.This was a novel
findingthat the authorsof the [Symthe82] were not
awareof. Experiments
are beingconducted
to investigatefurther
certainhypothesis
whichthis finding
has
prompted.
This resultis interestingin that the authorsof
[Symthe82] had only consideredthe effectsof the
231
alpha-2adrenegeric
blockeron hypothyroid
rats
ratherthaneffectof hypothyroidism
on alpha-2
adrenegeric
blocker
treated
rats.Thatis,theyhad
considered
theeffects
of treatment
groupsA versus
A+B but not B versusA + B eventhoughthe paper
contained
the dataneededfor bethcomparisons.
Although
thedatawashighly
statistically
significant,
the B versusA ÷ B comparison
was not madesince
theauthors
wereprimarily
interested
in stress,
not
hypothyroidism.
Theytherefore
studied
theeffects
of
stressin the presenceof hypothyroidism,
to see
whether
or thesamemechanisms
wereoperative
as in
otherstress
situations.
Thereverse
comparison
looks
at theeffectof hypothyroidism
in thepresence
of
stress,
a question
thattheauthors
werenotaddressing.Theresult
isofimportance
sinceitsuggests
that
theinteraction
between
serotonin
andnorepinephrine
described
in [Smythe
82]willhaveto be relocated.
This represents
a majorre-organisation
of the
[Symthe89]modeland to ourunderstanding
of the
interaction
between
norepinephrine
andserotonin.
Notethattheinformation
required
to gainthisnew
understanding
was available
priorto QMODbut had
notbeennoticed.
modelling
and simulation
programs
in the fieldof
enzymekinetics.
This systemis much closerto QMOD than CASNET
sinceit seeksto support
theexperimental
process.
Theknowledge
baseis structured
as nodesconnected
by causallinks.The KB has variouslevels,each
corresponding
to higher
andhigher
levels
of abstraction.Eachworkinghypothesis
in the KB mustbe
justified
by eitherexperimental
dataor by a new
experiment.
Meta-knowledge
abouta suiteof enzyme
kinetics
mathematical
modelling
andsimulation
programsis usedto proposeexperiments
usingthese
tools.If morethanoneexperiment
suggests
itself,
thenthebestdesign
is selected
afterapplying
certain
domain-specific
ranking
strategies.
[Soo 85] is ambiguousregardinghow the system
reactswhen an inconsistency
is detectedand
confirmedby new data and/orexperiments.
QMOD
provides
graphical
editing
toolsthatallowa domain
expertto quickly
experiment
withdifferent
models.
Thatis,inQMOD,hypothesis
revision
is theresponsibility
of theexpert.
The[Soo85]papersuggests
that
hypothesis
revision
couldbe doneautomatically
using
somesortof truthmaintenance
system.
TheQUAL/BKBI
systemis an interesting
experiment
in tightly-coupling
a KB witha specific
setof model2.1 CASNET
lingand simulation
tools.The QMODgoalis much
broader.
We
seek
to
develop
tool-independent
techTheclassic
studyofcausality
models
in Medical
AI is
niquesforformalising
qualitative
knowledge
abouta
theCASNETsystem([Weiss78]).CASNETstoresits
knowledge
in a three-layered
topology:
observations, domain.
pathophysiological
states,anddisease
categories. 2.3 STELLA
Cross-layer
linksexistbetween
nodesin eachlayer.
STELLA([Pytte 88]) is a graphical compaL:tmental
Causallinkswithnumericstrengths
of causation
modelling system. Superficially,
QMOD
resembles
(roughly
speaking,
thefrequency
withwhichstate
linkstostatej9existbetween
thepathophysiologicalSTELLA. For example, a STELLAmodel similar to
Figure One is shownin Figure Four.
states.
A complete
causal
pathway
froma startstate
to a terminal
staterepresents
theevolution
of a
disease.
Progression
alonga pathway
is usually
assountitled
ciated
withincreasing
seriousness
of thedisease.
2.
RELATED
WORK
CASNETdiffersfromQMODin severalways:
1. Thecoreof CASNET"s
inferencing
is fundamentallyquantitative
whileQMODis fundamentally
qualitative.
2. The two systems perform different tasks: QMOD
was designed for exploring inconsistencies
between data and models (and is hence
knowledge acquisition tool) while CASNETwas
built as a diagnosis system (and is hence
knowledgeexecution tool).
3. In our domain, QMOD
is an extension of current
practice, not a replacement. Our experts find
that the graphical front-end closes matchestheir
current practice. The use of CASNET, would
require them to change their mind-set to fit with
the CASNETformalism.
2.2
QUAL/BKBI
[Soo 85] describes an extension of the CASNET
approach. QUALand BKBI (Biochemical Knowledge
Base Interpreter)
are PROLOG
programs that help
formulate experiments using a set of mathematical
232
Figure 4. Modelling Figure One using Stella.
However, inferencing with STELLAis very different
than with QMOD.QMOD
is a qualitative
formalism
that can execute given qualitative
statements.
STELLAis a quantitative formalism that requires
precise numeric paramters before it can execute. In
certain domains, such as ours, the data is not available to the required precision and the STELLA formalisrn forces us to invent spurious information,
merely to get a behaviour.
Further,
STELLA is a
simulation tool while QMOD’sfunction is to detect
inconsistentcies
between the current models and the
known data.
2.4
ROUNDSMAN
[Rennels 89] describes another medical application
that uses research publications as the basis of their
knowledge base. Roundsman is a publication-centred
tool for augmenting a physician’s reasoning. Unlike
QMOD, the Roundsman system does not attempt to
model the underlying physiology of the domain. The
internal
knowledge structures
of Roundsman are
declarative
descriptions
of the publications
and
pointers to related publications.
The system has no
causal knowledge of disease processes. In essence,
Roundsman is a representation
of the discussion and
not the domain of the medical research literature.
3.
RESEARCH
offersno visualclue to how the factsare grouped
togetherinto experiments.
Futureversionsof QMOD
shoulddisplay
thisgrouping.
The currentHypercard
systemwas a usefulprototype.
However, it has certain drawbacks.QMOD can not
re-configureits display. An internationalQMOD
modelwouldbe very largeindeed.In orderto manage
it all,the systemneedsto be ableto re-configure
its
displays
and presentonlythe relevant
portions
to the
expert. We seek methods to discover nodes of interest
and hide nodes of dis-interest
from the user. Ideally,
all the nodes relating to a current problem should be
somehow displayed on one screen.
4.
REFERENCES
[Apple 87] Apple Technical Publications. (1987) Hypereard
Script Language Guide, APDA.
[Iwasaki 86] Iwasaki Y. & Simon H.A. Causality in Device
Behavior in Artificial Intelligence 29 (1988) 3-31.
[Kuipers 88] Kuipers B. Qualitative Simulation in Artificial
Intelligence 29, pp229-338.
[McIntosh 80] McIntosh J.E.A. & McIntosh R.P. (1980)
Mathematical Modelling and Computers in Endocrinology Springer-Verlag, Berlin.
DIRECTIONS
Our current research work has two main directions:
semantics and display.
[Pytte 88] STELLAv2.10 is copyright 1985, 1988 by High
Performance Software Inc. and was written by Anders
Pytte & Friends.
3.1 Semantics
Formal qualitative
reasoning theory could be used to
improve
QMOD. Early
experiments
with QSIM
[Kuipers 86] were not encouraging.
This approach
was abandoned due to the very large numbers of
behaviours
produced by even simple models. However, the casual ordering
formalism of Simon &
Iwasaki [Iwasaki 86] seems more promising. A causal
ordering is deduced from the equations which is a network that assigns causal links between variables.
This network is deduced from an abstracted
view of
how a symbolic algebraic system would deduce values
for the system.
Causal ordering allows us to combine qualitative
and
quantitative
knowledge about our system. Both can be
given as input to the causal ordering alogirthm.
Further,it shouldbe possibleto use causalordering
as the basisof a theoryrevision
algorithm.
It should
be possiblefor the user to make editsto the causal
graph and the systemto backtrackto proposerevisionsto the underlying
qualitative
and quantitative
model.
3.2 Display
The present system is a good match between the
graphicrepresentations
and the reasoning
thatcan be
carriedout. The modelhas no importantinformation
over whatcan be seen on the modelscreen.The histogram displayof the unresolved
data pointscaptures
the ordinalrelationsbetweenreal numbersthat the
model deals with. Data can be enterednumerically
but then manipulated
graphically.
Oneissuethathasto be resolved
is the bestgraphical
treatmentof the QMOD facts. Earlierversionsof
QMOD didn’t use them at all. The currentversion
233
[Rennels 89] Rennels G.D. , Shortliffe E.H., Stockdale F.E.,
Miller P.L. A Computational Model of Reasoning from
the Clinical Literature in AI Magazine, Spring 1989,
pp49-57.
[Sammut 83] Sammut C. & SammutR. The Implementation
of UNSW-Prolog, in Australian
Computer Journal
15(2), 1983, pp56-65.
[Soo 85] SOoV. , Kulikowski C.A. & Garfunkel D. Qualitative Modellingand Clinical Justification for Experimental Design in Artificial Intelligence in Medicine, De
Lotto I. & Stefanelli M. (eds), Elseview Science Publishers, B.V. (North-Holland) 1985, pp21-36.
[Symthe 82] Smythe G.A., DuncamM.W., Bradshaw J.E.,
Cai W.Y. & Symons R.G. Serotoninergic Control of
Growth Hormone Secretion: Hypothalmic Dopamine,
Norepinephrine and Serotonin Levels and Metabolism in
Three Hyposomatropic Rat Models and in Normal Rats
in Endocrinology 110 (2) pp376-383.
[Smythe 89] Smythe G.A. Brain-hypothalamus, Pituitary
and the Endocrine Pancreas in Smamols R. (eel) The
Endocrine Pancreas, Raven Press, NewYork, 1989.
[Weiss 78] Weiss S.M., Kulikowski CA. & Amarel S. A
Model-Based Method for Computer-Aided Medical
Decision.making in Artificial Intelligence 11 (1978),
pp145-172.


