From: ISMB-97 Proceedings. Copyright © 1997, AAAI (www.aaai.org). All rights reserved.
Generating
Benchmarks for Multiple Sequence Alignments
Phylogenetic Reconstructions
Jens Stoye
Research Center for Interdisciplinary Studies
on Structure Formation (FSPM),
University of Bielefeld
Postfach 100 131, 33501 Bielefeld, Germany
stoye@Mathematik.Uni-Bielefeld.DE
Abstract
Wepresent a new probabilistic modelof evolution of
RNA-,DNA-,or protein-like sequences and a tool rose
that implements this model. By insertion, deletion
and substitution of characters, a family of sequences
is created from a common
ancestor. Duringthis artificial evolutionaryprocess, the ’~true" history is logged
and the "correct" multiple sequence alignment is ereated simultaneously. Wealso allow for varying rates
of mutation within the sequences makingit possible
to establish so-called sequencemotifs. The results are
suitable for the evaluation of methodsin multiple sequence alignment computation and the prediction of
phylogeneticrelationships.
Introduction
It is useful for manyreasons to have a family of sequences with well-known evolutionary history: For
instance, in the study of evolutionary processes, for
the evaluation of methods which compute multiple
sequence alignments and/or reconstruct phylogenetic
trees, and for other tools in computational molecular biology. Unfortunately, nature does not provide
"benchmark" problems suited for all these applications.
It is generally not possible to retrieve all sequencesof
a given sequence family and there is no wayto learn the
exact phylogeny of the sequences involved. Therefore it
is common
practice to artificially create sequences with
the aim to obtain sequences similar to "real world" biological data. Of course, a family of unrelated random
sequences does not provide us with the data that we
need since species are part of a hierarchically structured phylogeny.
The simulation of evolutionary processes on the
molecular sequence level has a long tradition. Starting
with the model of Jukes and Cantor (Jukes & Cantor 1969), several generalizations and alterations have
been presented, e.g. (Kimura 1980; Felsenstein 1981;
Copyright0 1997, American
Associationfor Artificial Intelligence {’,.,.-ww.aaaJ.or8). All rights reserved.
and
Dirk
Evers
and Folker
Meyer
Technische Fakult~it
University of Bielefeld
Postfach 100 131, 33501 Bielefeld, Germany
{dirk,folker } @TechFak.Uni-Bielefeld.DE
Hasegawa, Kishino, & Yano 1985; SchSniger &von
Haeseler 1995). But in none of the methods known
to the authors, the length of the sequences is altered
by insertion and/or deletion (indels) of subsequences.
Wehave added indels and "sequence motifs" (patterns in a family of related sequences (Wu& Brutlag 1995)) to the so-called HKY-model(Hasegawa,
Kishino, & Yano 1985) to create more realistic
sequence families. The data created by our tool 1rose
(random-model of sequence evolution) has been extensively tested with our Divide and Conquer Alignment (T6nges et al. 1996; Stoye 1996) and GeneFisher (Giegerich, Meyer, & Schleiermacher 1996;
Meyer & Schleiermacher 1996) software packages.
Wesimulate an evolutionary process by iterated mutation of a "commonancestor sequence" following the
edges of a given "mutation guide tree". This way,
the topology of the tree induces the relationships of
the sequences. The mutations are performed by insertion, deletion, and substitution of single characters or
whole subsequences of the ancestor sequence. In addition to knowingthe exact evolutionary distance of the
sequences, our approach provides us with their whole
evolutionary history. Therefore, in contrast to biological applications, it is easily possible to verify predictions about phylogenetic relationships drawn from
the sequences simply by comparing the predicted phylogeny to the tree that was used in the creation process.
The
Model
Given
¯ an alphabet A of size l, e.g. the DNA-alphabet
{A, C, G, T} or the 20 character aminoacid alphabet,
¯ initial
character frequencies fl,..-,
ft satisfying
1
iThe software is available on our Bioinformatics WebServer BiBiServ under the following address:
http://bibiserv.
TechFak
.Uni-Bielef
eld.DE/rose/
Stoye
303
¯ a mutation matrix Mof size l × l representing pairwise mutation frequencies,
¯ and a rooted, edge labeled mutation guide tree T;
we generate
sk) with average
* a family of k sequences S = (sl,...,
length n and average pairwise evolutionary distance
¯ a multiple sequence alignment A of the sequences
sl,...,sk
that is optimal with respect to the creation process, i.e. it reflects the "true" evolutionary
history of sl .... , sk,
¯ and a relatedness tree T’ representing the phylogenetic relationship of the created sequences.
The underlying idea of our method is the following:
First of all, a commonancestor sequence of length
n is created and attached to the root of the tree T.
Then, the nodes connected with the root are filled
with "child" sequences created from the root sequence
by mutations where the length of the edge stands for
the evolutionary distance between the sequences. This
process is continued until the leaves of T are reached
and thus all nodes of the tree are filled with a sequence. Finally, from the sequences created this way,
the required number of k sequences is selected in a
random manner.
These sequences form the family
S = (sx,...,sk).
The multiple sequence alignment A is created by replacing deleted subsequences with gap characters in
the selected sequence and inserting gap characters into
all but the selected sequence for insertions. In this
way we generate an alignment that reflects the "true"
evolutionary history of the sequences.
T’ is the smallest subtree of T which contains all
the nodes corresponding to the selected sequences (and
possibly some additional inner nodes which can be seen
as extinct ancestors).
The Root
Sequence
Each of the n positions in the root sequence is filled
by a random process that takes the character frequencies fl,...,
fl for the given alphabet into account. For
amino acid sequences, we implemented as default values the normalized .frequencies of the aminoacids given
in (Dayhoff, Schwartz, & Orcutt 1979) and for nucleotides we use the frequencies given in (Agarwal
States 1996).
Alternatively, we also allow a pre-given root sequence.
304
ISMB-97
Creation
of Child
Sequences
Starting from a given sequence Sold, we create a new
sequence shed. The following steps are used to create
a new "descendant" sequence:
1. Weapply the mutation function mutate for the given
alphabet to every position i in Sold:
Sne~[i] = mutate(sold[i], b)
where b is the branch length for leading to the new
node. The mutation matrix is selected with respect
to b, please see below.
2. We delete one or more subsequences from Shed;
an arbitrary deletion probability Pd~l and arbitrary
deletion length function Idel Canbe specified.
3. Weinsert one or more gaps of arbitrary length at
arbitrary positions in Sne~; again, an insertion probability pi,s and insertion length function li~s can be
specified. The characters inserted maintain the initial character distribution.
Note that the average sequence length remains n only
if Pins = Pdel andlin, = ldet.
In case the mutation matrix M is the probability
matrix of one accepted aminoacid substitution per hundred sites (1 PAM)given in (Dayhoff, Schwartz, &
cutt 1979) - which is our default for proteins - we
denote this new unit of measure for the distance of a
child sequence from its ancestor including insertions
and deletions by 1 PAM*where the parameters for insertions and deletions have to be specified additionally.
Evolutionary rates of more than 1 PAM*axe obtained by applying the creation procedure repeatedly.
As SchSniger and v. Haeseler (SchSniger & yon Haeseler 1995) have shown, the use of a custom matrix
(such as PAM10) helps to save time when the number
of substitutions exceeds an upper bound. At each step
along an edge of the guide tree, depending on the mutation rate, the decision is madeeither to use one of
the precomputed PAM*matrices or to compute a new
custom matrix in order to save time.
Sequence
Motifs
Up to this point, we have assumed a constant rate
of mutation over the whole length of the sequences.
However,this is not very realistic: The mutation rate
of genomic sequences found in nature is not constant
for all positions in the genome. Mutations in regions
with strong functional and/or structural importance
are less often observed.
Therefore, we implemented a feature that allows the
use of different rates of mutation for different regions
(a)
FSAEAALVSPGKGDDEQVPNKDKCVYHGHKDGKRMNVKTPPTGPLWGVHQ
YEGANEVGATCEESSYCYVKEQAIQVKESQECTDFAKHEVKSFRGVPGKLTEVIPVPL
YGAAHPVGDPIKLGSLFLNHYESKGHTAAMCLLGMKTELIEPIEVQA
SGVTEPVPNPVPATGIKLDKYTfUIENCLGMCLMGMGPPMVTIGEVGI
(b)
FSAEAALVSP
........GKGDDEQVPNKDKCVYfIGHKDGKKMNVKTPPTGPLVVGVHQ
YEGANEVGATCEESSYCYVKEQAIQVKESQECTDFAP~EVKSFRGVPGKLTEV-IPVPL
YGAAHPVGDP........
IKLGSLFLNH---YESKGHTAAMCLLGMKTELIEP-IEVQA
SGVTEPVPNP
VPATGIKLDK---YTRF./~CLGMCLMGMGPPMVTI-GEVGI
(c)
FSAEAALVSP........GKGDDEQVPNKDKCVYHGHKDGKRMNVKTPPTGPLWGVHQ
YEGANEVGATCEESSYCYVKEQAIQVKESQECTDFAKHEVKSFRGVPGKLTE-VIPVPL
YGAAHPVGDP........
IKLGSLFL---NHYESKGHTAAMCLLGMKTELIE-PIEVQA
SGVTEPVPNP
........
VPATGIKL---DKYTKEENCLGMCLMGMGPPMVT-IGEVGI
Figure h (a) Sample family of random sequences obtained with the procedure described in the text for n =
and k = 4; (b) "true" alignment of these sequences; (c) an optimal alignment according to PAM250 substitution
matrix and gap function g(l) = 8 + 12
of the sequence. Weuse a vector to specify the degree
of conservation at every position in the sequence. This
wayit is possible to establish well-conserved motifs in
the whole sequence family created.
The Mutation
Guide Tree
In the general case, the user can specify any rooted,
edge-labeled mutation guide tree. Given a mutation
guide tree, the average sequence distance day (in units
of PAM*)can be computed, i.e. the expected length of
a shortest path between two randomly chosen nodes in
the tree. If no tree is entered by the user, we compute
a pruned binary mutation guide tree for a user defined
average sequence distance.
Example: A Protein
Sequence Family
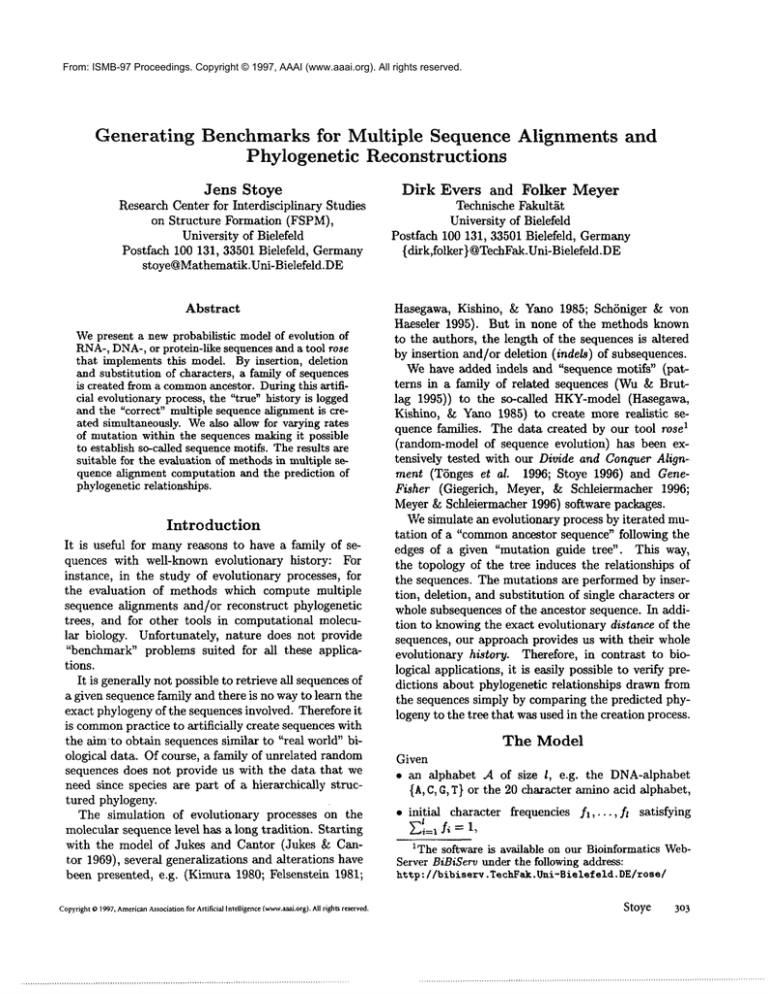
The following example shows some of the features
of our approach. In Figure 1 (a), a sample family
with k -- 4 sequences of average length n = 50 is
shown. This family is created with the default settings of rose: A uniform binary mutation guide tree of
depth m = 9 and uniform edge length R = 18 PAM*.
The probability for insertions and deletions is set to
P~s = Pde! -’~ 0.3% and the insertion and deletion
length functions are exponentially decreasing with a
maximal length value of 10. These parameters can be
shown to yield a family of amino acid sequences with
average sequence distance of da, = 250 PAM*(Stoye
1997).
The alignment given in Figure 1 (b) is the "true"
alignment corresponding to the creation process of
the sequences. Figure 1 (c) shows the "optimal"
alignment according to the PAM250 substitution
matrix (Dayhoff, Schwartz, & Orcutt 1979) (in distance form with values between 0 and 24) and gap
function g(l) = 8 + 12/ computed with the program MSA(Lipman, Altschul, & Kececioglu 1989;
Gupta, Kececioglu, & Sch~iffer 1995). While the overall
optimal alignment is correct, the exact location of the
gaps does not coincide in all cases. The scores for both
alignments show these differences as well: The "true"
alignment has an alignment score of 5184, while the
"optimal" alignment a has a score 5166. This shows
that - as is well-known- an optimal alignment is not
neccessarily the correct one.
Figure 2 shows the corresponding relatedness tree T’
of these sequences.
Conclusion
The data sets created by rose are the first artificially
created sequence families that contain both indels and
motifs. The evaluation of multiple sequence alignment
tools and phylogenetic reconstruction tools is nowpossible with the benchmarks created.
However, we still have used some approximations:
While we do not assume that the characters of the
sequences evolve independently and with the same
rate in the whole family, we have not yet included
a feature that simulates different rates of evolutionary pressure in different branches of the tree, enabling
different lineages to evolve independently within our
tree. This has been observed by a numberof biologists
several times (Greer 1981; 1990; Schulz et al. 1986;
Benner, Cohen, & Gonnet 1994). While we are planning to include this feature in a future release of rose
and extend the scope of our model even further, it is
important to note that simulations can only aid the
evaluation of algorithms. The use of tea/sequences is
indispensable for the evaluation of software in Bioinformatics.
Stoye
305
Gupta, S. K.; Kececioglu, J. D.; and Sch~er, A. A.
1995. Improving the Practical Space and Time Efficiency of the Shortest-Paths Approach to Sum-ofPairs Multiple Sequence Alignment. J. Comp. Biol.
2(3):459-472.
Hasegawa, M.; Kishino, H.; and Yano, T. 1985. Dating of the Human-ApeSplitting by a Molecular Clock
of Mitochondrial DNA.J. Mol. Evol. 22:160-174.
Figure 2: Relatedness tree for the sequences shown in
Figure 1.
Acknowledgements
The authors wish to thank Robert Giegerich for his
helpful commentson an earlier version of this article.
The work was partially supported by the GermanMinistry for Education and Sciences (BMBF), the Ministry of Science of North Rhine Westfalia (MWF-NRW)
and the German Research Council graduate program
(DFG-GK)Strukturbildungsprozesse.
References
Agarwal, P., and States, D. J. 1996. A Bayesian
Evolutionary Distance for Parametrically Aligned Sequences. J. Comp. Biol. 3(1):1-17.
Benner, S. A.; Cohen, M. A.; and Gonnet, G. H. 1994.
AminoAcid Substitution during Functionally Constrained Divergent Evolution of Protein Sequences.
Protein Engng. 7(11):1323-1332.
Dayhoff, M. O.; Schwartz, R. M.; and Orcutt, B. C.
1979. A Model of Evolutionary Change in Proteins.
In Dayhoff, M. O., ed., Atlas of Protein Sequence and
Structure, volume 5, suppl. 3. Washington, D.C.: National Biomedical Research Foundation. 345-352.
Jukes, T. H., and Cantor, C. R. 1969. Evolution of
Protein Molecules. In Munro, H. N., ed., Mammalian
Protein Metabolism, volume 3. Academic Press, New
York, NY, USA. 21-132.
Kimura, M. 1980. A Simple Method for Estimating Evolutionary Rates of Base Substitutions through
Comparative Studies of Nucleotide Sequences. J. Mol.
Evoi. 16:111-120.
Lipman, D. J.; Altschul, S. F.; and Kececioglu, J. D.
1989. A Tool for Multiple Sequence Alignment. Proc.
Natl. Acad. Sci. USA 86:4412-4415.
Meyer, F., and Schleiermacher, C. 1996. Genefisher.
http://bibiserv.techfak.uni-bielefeld.de/genefisher/.
SchSniger, M., and von Haeseler, A. 1995. Simulating
Efficiently the Evolution of DNASequences. CABIOS
11(1):111-115.
Schulz, G. E.; Schiltz, E.; Tomasselli, A. G.; Frank,
R.; Brune, M.; Wittinghofer, A.; and Schirmer, R. H.
1986. Structural Relationships in the Adenylate Kinase Family. Eur. J. Biochem. 161:127-132.
Stoye, J. 1996. DCA: Divide and Conquer Multiple Sequence Alignment. http://bibiserv.techfak.unibielefeld.de/dca/.
Stoye, J. 1997. Divide-and-Conquer Multiple Sequence Alignment. Dissertation, Technische Fakult~t
der Universit~t Bielefeld.
Felsenstein, J. 1981. Evolutionary Trees from DNA
Sequences: A Maximum Likelihood Approach. J.
Mol. Evol. 17:368-376.
TSnges, U.; Perrey, S. W.; Stoye, J.; and Dress, A.
W.M. 1996. A General Method for Fast Multiple
Sequence Alignment. Gene 172:GC33-GC41.
Giegerich, R.; Meyer, F.; and Schleiermacher, C.
1996. GeneFisher-Software support for the detection
of postulated genes. In Proc. of the Fourth Conference
on Intelligent Systems for Molecular Biology, ISMB
96, 68-78. AAAIPress, Menlo Park, CA, USA.
Greer, J. 1981. Comparative Model-Building of the
MammalianSerine Proteases. J. Mol. Biol. 153:10271042.
Wu, T. D., and Brutlag, D. L. 1995. Identification of
Protein Motifs Using Conserved Amino Acid Properties and Partitioning Techniques. In Proc. of the
Third Conference on Intelligent Systems for Molecular Biology, ISMB 95, 402-410. AAAIPress, Menlo
Park, CA, USA.
Greer, J. 1990. Comparative Modeling Methods:
Applications to the Family of the MammalianSerine Proteases. PROTEINS:Structure, Function, and
Genetics 7:317-334.
306
ISMB-97
Copyright(c) 1997, AmericanAssociationfor Artificial
Intelligence (www.aaai.org).All rights reserved.


