Serendipitous Characterization of the Microwave Sounding Unit Thomas J. Kleespies
advertisement
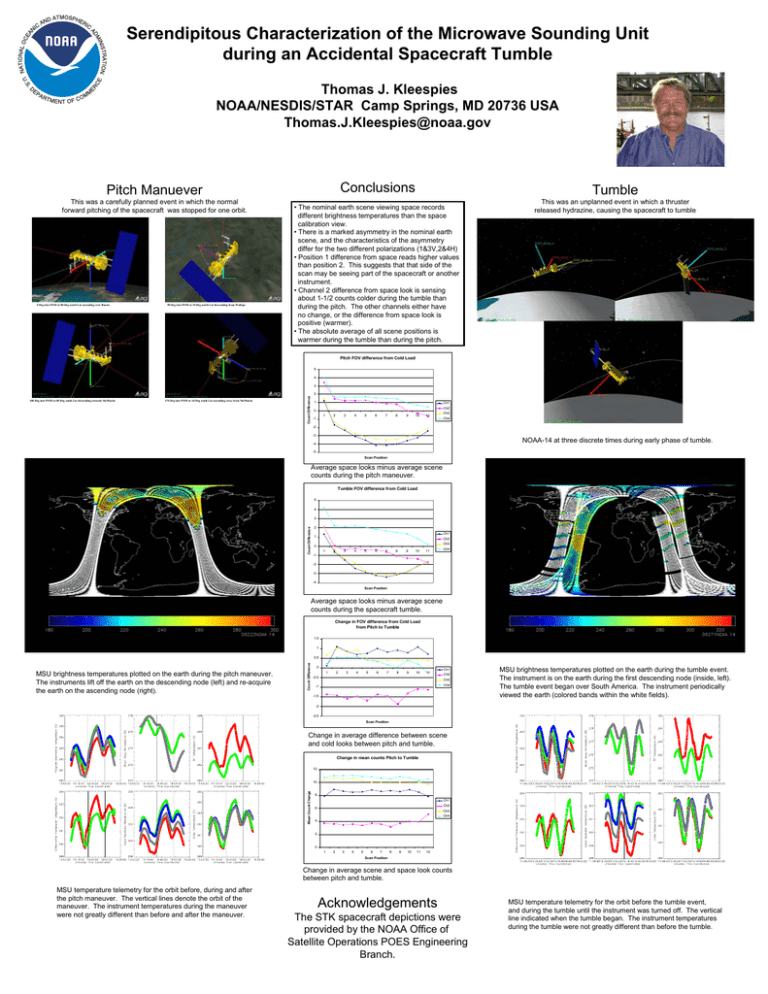
NATIONAL OC EA D ATMOSPHER AN IC Serendipitous Characterization of the Microwave Sounding Unit during an Accidental Spacecraft Tumble TRATION NIS MI AD C NI Thomas J. Kleespies NOAA/NESDIS/STAR Camp Springs, MD 20736 USA Thomas.J.Kleespies@noaa.gov D ER S. CE U. EP AR TME O NT OF C MM Conclusions Pitch Manuever This was a carefully planned event in which the normal forward pitching of the spacecraft was stopped for one orbit. 0 Deg into POM at 80 Deg north Lat ascending over Russia 90 Deg into POM at 10 Deg north Lat descending from Wallops Tumble • The nominal earth scene viewing space records different brightness temperatures than the space calibration view. • There is a marked asymmetry in the nominal earth scene, and the characteristics of the asymmetry differ for the two different polarizations (1&3V,2&4H) • Position 1 difference from space reads higher values than position 2. This suggests that that side of the scan may be seeing part of the spacecraft or another instrument. • Channel 2 difference from space look is sensing about 1-1/2 counts colder during the tumble than during the pitch. The other channels either have no change, or the difference from space look is positive (warmer). • The absolute average of all scene positions is warmer during the tumble than during the pitch. This was an unplanned event in which a thruster released hydrazine, causing the spacecraft to tumble Pitch FOV difference from Cold Load 5 4 3 270 Deg into POM at 10 Deg south Lat ascending away from McMurdo Count Difference 2 180 Deg into POM at 80 Deg south Lat descending towards McMurdo 1 Ch1 Ch2 0 1 2 3 4 5 6 7 8 9 10 11 -1 Ch3 Ch4 -2 -3 NOAA-14 at three discrete times during early phase of tumble. -4 -5 Scan Position Average space looks minus average scene counts during the pitch maneuver. Tumble FOV difference from Cold Load 5 4 Count Difference 3 2 Ch1 1 Ch2 0 1 2 3 4 5 6 7 8 9 10 11 Ch3 Ch4 -1 -2 -3 -4 Scan Position Average space looks minus average scene counts during the spacecraft tumble. Change in FOV difference from Cold Load from Pitch to Tumble 1.5 1 MSU brightness temperatures plotted on the earth during the pitch maneuver. The instruments lift off the earth on the descending node (left) and re-acquire the earth on the ascending node (right). Count Difference 0.5 0 1 2 3 4 5 6 7 8 9 10 11 -0.5 Ch1 Ch2 Ch3 Ch4 -1 -1.5 MSU brightness temperatures plotted on the earth during the tumble event. The instrument is on the earth during the first descending node (inside, left). The tumble event began over South America. The instrument periodically viewed the earth (colored bands within the white fields). -2 -2.5 Scan Position Change in average difference between scene and cold looks between pitch and tumble. Change in mean counts Pitch to Tumble 12 Mean Count Change 10 8 Ch1 Ch2 6 Ch3 Ch4 4 2 0 1 2 3 4 5 6 7 8 9 10 11 12 Scan Position Change in average scene and space look counts between pitch and tumble. MSU temperature telemetry for the orbit before, during and after the pitch maneuver. The vertical lines denote the orbit of the maneuver. The instrument temperatures during the maneuver were not greatly different than before and after the maneuver. Acknowledgements The STK spacecraft depictions were provided by the NOAA Office of Satellite Operations POES Engineering Branch. MSU temperature telemetry for the orbit before the tumble event, and during the tumble until the instrument was turned off. The vertical line indicated when the tumble began. The instrument temperatures during the tumble were not greatly different than before the tumble.
