The use artificial neural networks to diagnose mastitis in dairy cattle of P.O.
advertisement
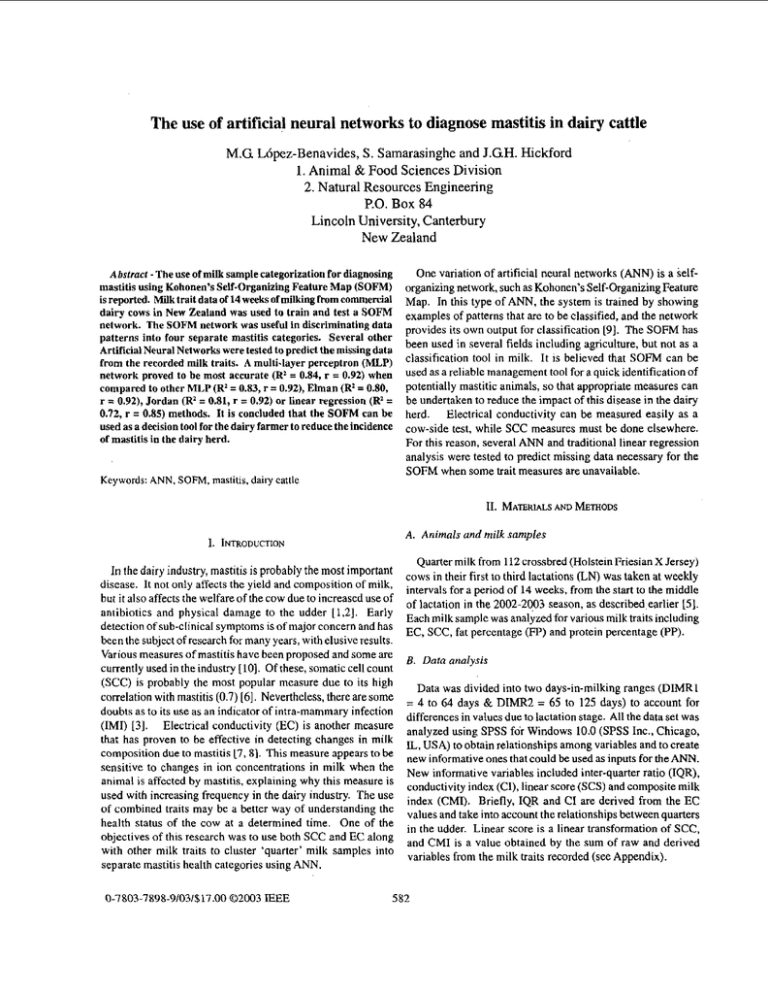
The use of artificial neural networks to diagnose mastitis in dairy cattle M.G L6pez-Benavides, S. Samarasinghe and J.GH. Hickford 1. Animal & Food Sciences Division 2. Natural Resources Engineering P.O. Box 84 Lincoln University, Canterbury New Zealand Absfracf- The use of milk sample categorization for diagnosing mastitis using Kohonen’s Self-organizing Feature Map (SOFM) is reported. Milk trait data of 14 weeks of milking from commercial dairy cows in New Zealand was used to train and test a SOFM network. The SOFM network was useful in discriminating data patterns into four separate mastitis categories. Several other Artificial Neural Networks were tested to predict the missing data from the recorded milk traits. A multi-layer perceptron (MLP) network proved to he most accurate (R1= 0.84, r = 0.92) when compared to other MLP (R1=0.83, r = 0.92), Elman (R2= 0.80, r = 0.92), Jordan (RI= 0.81, r = 0.92) or linear regression (R’= 0.72, r = 0.85) methods. It is concluded that the SOFM can be used as a decision tool for the dairy farmer to reduce the incidence of mastitis in the dairy herd. Keywords: ANN, SOFM, mastitis, dairy cattle One variation of artificial neural networks (ANN) is a selforganizing network, such as Kohonen’s Self-organizing Feature Map. In this type of ANN, the system is trained by showing examples of patterns that are to be classified, and the network provides its own output for classification [9]. The SOFM has been used in several fields including agriculture, but not as a classification tool in milk. It is believed that SOFM can be used as a reliable management tool for a quick identification of potentially mastitic animals, so that appropriate measures can be undertaken to reduce the impact of this disease in the dairy herd. Electrical conductivity can be measured easily as a cow-side test, while SCC measures must be done elsewhere. For this reason, several ANN and traditional, linear regression analysis were tested to predict missing data necessary for the SOFM when some trait measures are unavailable. AND METHODS 11. MATERIAU A. Animals and milk samples 1. INTRODUCTION In the dairy industry, mastitis is probably the most important disease. It not only affects the yield and composition of milk, hut it also affects the welfare of the cow due to increased use of antibiotics and physical damage to the udder [1,21. Early detection of sub-clinical symptoms is of major concern and has been the subiect of research for many. .years, with elusive results. Various measures of mastitis have been proposed and some are currently used in the industry [IO]. Of these, somatic cell count (SCC) is probably the most popular measure due to its high correlation with mastitis (0.7)[6].Nevertheless, there are some doubts as to its use as an indicator of intra-mammary infection (IMI) [3]. Electrical conductivity (EC) is another measure that has proven to he effective in detecting changes in milk composition due to mastitis [7, 81. This measure appears to he sensitive to changes in ion concentrations in milk when the animal is affected by mastitis, explaining why this measure is used with increasing frequency in the dairy industry. The use of combined traits may be a better way of understanding the health status of the cow at a determined time. One of the objectives of this research was to use both SCC and EC along with other milk traits to cluster ‘quarter’ milk samples into separate mastitis health categories using ANN. 0-7803-7898-9/03/$17.00 Q2003 IEEE Quarter milk from 112crossbred (Holstein Friesian X Jersey) cows in their first to third lactations (LN) was taken at weekly intervals for a period of 14 weeks, from the start to the middle of lactation in the 2o02.2003 as described earl,er ~ 5 1 , Each ,,,ilksample was analjzedforvarious milktraits including EC, see, fat percentage (Fp) and protein percentage (pp), B. Data analysis Data was divided into two days-in-milking ranges (DIMRI = 4 to 64 days & DIMRZ = 65 to 125 days) to account for differences in values due to lactation stage. All the data set was analyzed using SPSS for Windows 10.0 (SPSS Inc., Chicago, IL,USA) to obtain relationships among variables and to create new informative ones that could be used as inputs for the ANN. New informative variables included inter-quarter ratio (IQR), conductivity index (CI), linear score (SCS) and composite milk index (CMI). Briefly, IQR and CI are derived from the EC values and take into account the relationships between quarters in the udder. Linear score is a linear transformation of SCC, and CMI is a value obtained by the sum of raw and derived variables from the milk traits recorded (see Appendix). 5 82 ANOVAof means led to a grouping of data into four separate datasets, i.e. LNI&Z-DIMRl, LNl&Z-DIMRZ, LN3-DIMRI & LN3-DIMR2. Also, electrical conductivity and Composite Milk Index were chosen as the most important variables as inputs for the SOFM. Data was graphed using SigmaPlot for Windows 5.00 (SPSS Inc., Chicago, IL,USA). C. Clustering of datasets into health categories and therefore it can be suggested that the results are representative of the mastitic state of the cow. Moreover, since the differences between lactation number and days-in-milking were taken into account, it reflects the change in milk composition that the animal suffers throughout its productive life. K-means clustering of LNM2-DIMRI had a correlation of 0.89 (P < 0.01) with the one obtained with SOFM, while it was 0.91 (P < 0.01) for LNM2-DIMRZ. For LN3-DIMR1 and LN3-DIMR2 the correlations were 0.87 and 0.84 with the SoFM results, respectively. Data sets from defined LN and DIMR were clustered into separate health categories using NeuroShellB 2 (Ward Systems Bacteriological analysis is usually considered a ‘gold Group, Frederick, MD, USA). Electrical conductivity and CMI were used as inputs. The unsupervised SOFM algorithm [41 standard‘ for mastitis diagnosis [7]. Overall, only 9.55% of was used IO cluster data patterns from each set into four arbitrary quarters were positive for any bacteriological growth. The health categories, i.e. healthy (HO), moderately ill (HI), ill (H2) SOFM network showed that the frequencies of positive cases and severely ill (H3). Clustering was also tested on each dataset were 7.37% (healthy), 8.94% (moderately ill), 10.11%(ill) and using the K-means method. 50% (severely ill) (see Table 1). There were less than 20 cases with clinical symptoms such as clots or blood in the milk and D. Prediction of Composite Milk Index using ANN about 50% of those were assigned to either the ill or severely ill categories. The other quarters were considered to be healthy Since EC can be easily measured as a cow-side test during or moderately ill by the network. Even though there was an milking, the prediction of CMI from EC and its derivatives (i.e. increase in positive cases as quarters were considered IQR and CI) was tested. Four different ANN and a linear increasingly ill, bacteriology was not a reliable standard for regression method were tested to predict CMI. This included diagnosis. This may be due to cows being treated with two multi-layer perceptron (MLP), a Jordan and an Elman antibiotics prior tosampling or because some cows developed networks [SI. The MLPs consisted of three layers: an input a rapid and effective immune response to infection. It is notable layer of 3 nodes of linear activation function (LiAF), a hidden that 7.37% of healthy cases were positive for bacteria, which layer of either SO (MLP 1) or 100 (MLP 2) nodes of logistic suggests that in these cases, no detectable changes in milk traits activation function (LAF), and an output layer of 1 node (LAF). were detected. The Elman recurrent network consisted of an input of 3 nodes (LiAF), a hidden layer of 50 nodes (LAF), a recurrent context Although the differences in means between moderately ill or layer of SO nodes and an output layer of 1node (LAF). Finally, ill categories were statistically significant in all datasets, perhaps the Jordan recurrent network consisted of an input layer of 3 a combined category of these two, or an expansion to a further nodes LiAF, a hidden layer of 50 nodes (LAF), a context layer category could make these differences more noticeable. Conductivity Index, electrical conductivity and CMI were the of I node and an output layer of 1 node (LAF). most important indicators of mastitis status. while the SCC and The complete dataset used for prediction consisted of SO60 fat percentage significance varied. As animals became more data patterns of which 60% were used for training, 20% for ill, SCC values tended to increase as well as Conductivity Index testing the network, and 20% as a validation set. The learning and CMI (Figure 1). It is generally accepted that an increase in rate and momentum were 0.1 and the network was trained for SCC reflects the body’s immune status, i.e. higher values mean 500 epochs. a possible infection in the quarter, while lower values resemble a healthy one (31. The only difference in SCC values was in A N D DISCUSSION LN3, where this tendency was not followed (Table I). This is 111. RESULTS probably due to the lack of sufficient data needed for training the network. It is suggested that CMI be used as an indicator of A. Health categories mastitic status because it encompasses several milk traits into The SOFM proved to be useful in clustering the data into one single measure. statistically significant mastitis categories (Table I). This is the first recorded use of an SOFM for this purpose. Previously, B. Prediction of Composite Milk Index using ANN a back-propagation ANN was used to detect mastitis from dairy herd improvement records, with an overall accuracy of 0.86 The training mean R’ for all the prediction methods was [I I]. But as the authors concluded, new sources of information around 0.70 and the correlation was about 0.82. In the training would have made the categorization more accurate. This SOFM dataset, the Elman & Jordan networks proved to be better used several milk traits that were highly informative to mastitis predictors of CMI than the MLP (Table 2). The IQR and 583 Conductivity Index Index Figure I . Scatter plot of SCC, Conductivity Index and CMI according to the mastitis categories Table I. Means (SEM) of milk sails according to health categories Microbiology Health category HO DIMRl ;; H3 S C C N 723 1518 1431 25 LN1&2 DlMRl LN 3 DlMR2 74 f 6 91rll 203 f 2 3 3 1 4 0 t 784 55 t 7 69 2 19 368 + 88 2319t1213 rr~bm~m FP (96) CI 4.3 f 0.1 -0.02 f 0.0 n EC Positive (5) 495 + 1 433t0 377 t I 226* 5 36 113 136 9 4.98 7.44 9.50 36.W 3.9 0.1 -0.03 t 0.0 492 r I 2.9+0.1 0.63 20.0 448 1 2.5 +o.l 385 t I 1.24 rO.0 0 . 9 r 0 . 2 5 . 4 2 t l . l 227227 36 57 38 0 12.50 10.22 12.88 3.6rO.O 3.2 t o . 0 2.2 t 0 . 3 0.65fO.O 1.29 t O . 0 5.33 t0.2 * H3 295 3 12.9 r 0.2 16.9 t 0.2 2 3 . 6 t 0.7 129.7t51.7 HO HI H2 H3 24 54 39 18 14.7 t 0.6 19.8 t 0.5 24.0 f 0.5 3 6 . 0 r 1.7 5 5 r 20 62t12 42r9 303 r 7 8 4.2 *0.4 3.7t0.2 3.6 t 0 . 2 5.4*o.4 0.21 r 0 . l 0.73tO.O 1.25 t 0.0 1.46 t 0.1 471 t.5 428+2 378 + 1 361 t 5 2 6 5 13 8.33 11.11 12.82 72.22 HO 24 17 15.3 r 0.7 1 9 . 2 t 0.9 21.1rO.8 32.3 f 1.3 5 2 r 12 58 t 13 40+8 257 f 4 3 3.6 +O.z 3.5 t O . 3 3.1*0.2 4.5 *0.4 0.27 t0.0 0.66tO.O 1.lltO.O 1.40tO.I go+3 4 16 2 16.67 29.41 IO 55.56 HO DIMR2 CMI 12.9 f 0.1 18.9rO.l 25.7 t 0.3 108.7 t 9.8 :i H2 H3 288 558 25 18 584 * 428f3 387f3 376 + 5 0.00 8.00 Conductivity Index variables tended to contribute more to the 141 T. Kahonen, SelfOrgonizing Maps. New York, USA: Springer Verlag. 1995. model than Electrical Conductivity (Table 2). In the validation [5] M.G. Upez-Benavides, S. Samarasinghe and J.G.H. Hickford, "The dataset, the R' increased to about 0.80 and the correlation to use of combined milk trails to determine maslitis status using 0.91 (Table 3). In this dataset, the MLP networks had a higher artificial neural network.'' unpublished. R' compared to the other ones. Among the networks, MLP 2 161 R.A. Mrode and G.J.T. Swanson. "Genetic and Statistical properties of somatic cell count and its suitability as an indirect means of reducing had the best results in predicting CMI, followed by the MLP 1, the incidence of mastitis in dairy cattle," Animol Breeding Abstracts, Jordan, Elman and linear regression networks. vol. 64, pp. 847-57. 1996. Better results in estimating CMI could be obtained if more data were available for training the network. When SCC, fat and protein values are not available and only EC measures can be recorded, it could be possible to predict CMI from EC, IQR and CI. This method could prove to be a useful decision tool to the dairy farmer who needs to have instant data of cows for management decisions, such as preventive treatment or culling animals from the herd. Table 2. Training dataset of the methods used to predict CMI Relative Factor [7] M. Nielen, H. Deluyker, Y.H. Schukken and A. Brand, "Electrical conductivity of milk measurement, modifiers, and meta analysis of mastitis detection piiformance: J. Dairy Sci., ~01.75,pp. 606-14. 1992. [E] M. Nielen, Y.H. Schukken, A. Brand, S. Haring and R.T. Ferwerda. van Zonneweld. "Comparison of analysis techniques for on-line detection of clinical mastitis: J. Dairy Sci., vol. 78, pp. 1050-61. 1995. [Y] J.C. Principe, N.R. Euliano and W.C. Lefebvre, Neural andAdaptive Systems. New York, USA: John Wiley & Sons,Inc. 2000. [IO] K.R.S. Rao, "Mastitis milk - physical and chemical tests for detection,'' Indian J. Dairy di Bio-Sciences, vol. 8, pp. 57-60. 1997. [Ill X.Z. Yang, R. Lacroix and K.M. Wade, "Investigation into the production and conformation traifS associated with clinical mastitis using artificial neural networks," Canadian J. Animal Sci., vol. 80. pp. 415-425. 2000. Contribution Prediction Method SEM Rf r MLP I MLP 2 Elman Jordan Linear regression 33.25 33.43 34.03 34.01 35.94 0.742 0.741 .0.736 0.736 0.722 0.86 0.86 0.86 0.86 0.85 EC IQR CI 0.25 0.33 0.22 0.21 0.37 0.35 0.42 0.32 APPENDIX 0.38 0.32 0.37 0.31 1. Inter-Quarter Ratio (IQR) [QRi =- Table 3. Validation dataset of the methods used to predict CMI Predict ion Method SEM R' r MLP I MLP 2 Elman Jordan Linear regression 33.68 31.85 39.47 37.89 35.94 0.826 0.836 0.796 0.805 0.722 0.92 0.92 0.92 0.92 0.85 c 4 ECj EC, where i = quarter number j = iteration number for quarter 2. Conductivity Index (Cl) [[3] CIi=2+ - -IQ&. 3. Linear Score (SCS) ACKNOWLEDGEMENTS This research was funded by Fonterra Co-op Group Ltd. Special acknowledgements for the people that helped carry out the sampling, theLincoln University dairy farm staff,Livestocli Improvement Corporation Ltd, Dexcel and Shoof International. 4. Composite Milk Index (CM0 CMI, = IQR, + FP, + PP, + SCS,+ Cli + A, + Bi + C,+ D, + E , where: A, = In (PPj*FPc);B*= (Cl,*SCSJ;C,= (CI,*FP): D. = fCIj*PP,l; E.= fA,*Bjl REFEBENCS M.J. Auldist and i.B. Hubble, "Effect of mastitis on raw milk and dairy producu," The Australian J. Dairy Tech., vol. 53, pp. 28-36. 1998. C. Fourichon, H. Seegers, N. Bareilk and E Beaudeau, "Effects of disease on milk production in the dairy cow: a review: Preventive VererinaryMedicine. vol. 41, pp. 1-35. 1999. M.E. Kehrli and D.E. Shuster, "Factors affecting milk somatic cells and their role in health of the bovine mammary gland: J. Dairy Sci.. vol. 77, pp. 619-27. 1994. 585
