12.808
advertisement
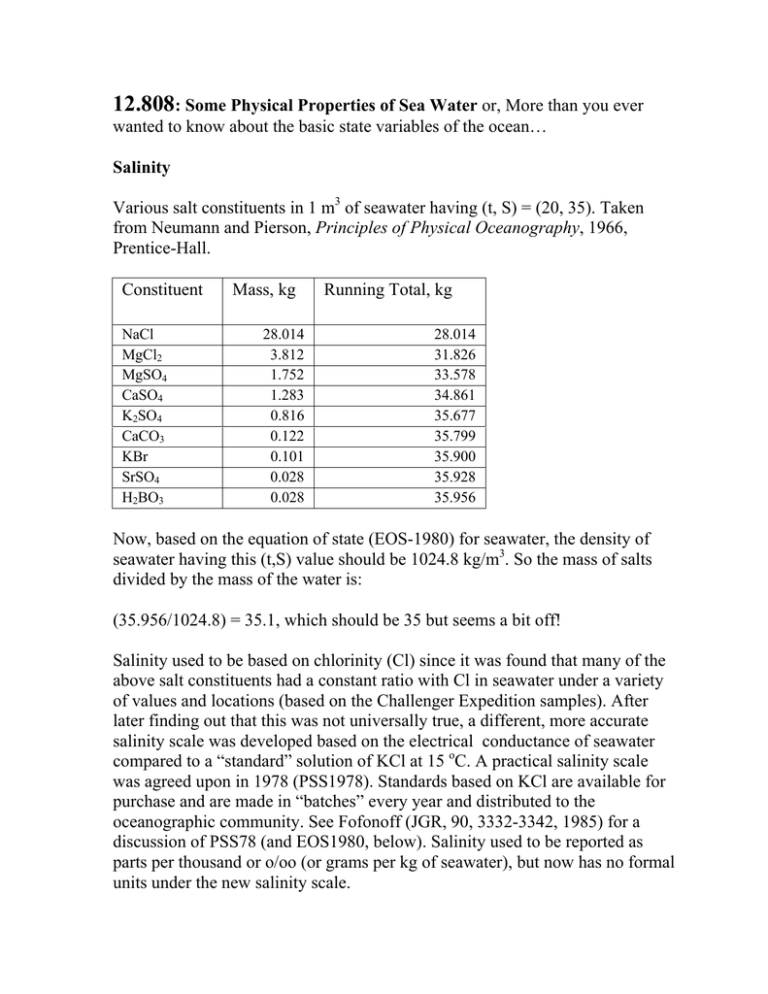
12.808: Some Physical Properties of Sea Water or, More than you ever wanted to know about the basic state variables of the ocean… Salinity Various salt constituents in 1 m3 of seawater having (t, S) = (20, 35). Taken from Neumann and Pierson, Principles of Physical Oceanography, 1966, Prentice-Hall. Constituent NaCl MgCl2 MgSO4 CaSO4 K2SO4 CaCO3 KBr SrSO4 H2BO3 Mass, kg 28.014 3.812 1.752 1.283 0.816 0.122 0.101 0.028 0.028 Running Total, kg 28.014 31.826 33.578 34.861 35.677 35.799 35.900 35.928 35.956 Now, based on the equation of state (EOS-1980) for seawater, the density of seawater having this (t,S) value should be 1024.8 kg/m3. So the mass of salts divided by the mass of the water is: (35.956/1024.8) = 35.1, which should be 35 but seems a bit off! Salinity used to be based on chlorinity (Cl) since it was found that many of the above salt constituents had a constant ratio with Cl in seawater under a variety of values and locations (based on the Challenger Expedition samples). After later finding out that this was not universally true, a different, more accurate salinity scale was developed based on the electrical conductance of seawater compared to a “standard” solution of KCl at 15 oC. A practical salinity scale was agreed upon in 1978 (PSS1978). Standards based on KCl are available for purchase and are made in “batches” every year and distributed to the oceanographic community. See Fofonoff (JGR, 90, 3332-3342, 1985) for a discussion of PSS78 (and EOS1980, below). Salinity used to be reported as parts per thousand or o/oo (or grams per kg of seawater), but now has no formal units under the new salinity scale. Temperature Temperature is measured in an absolute scale (degrees Kelvin, oK) from absolute zero, a temperature of zero molecular motion. Other benchmarks have been picked somewhat arbitrarily based on properties of various substances, which are readily available and have some rather stable properties. The temperature scale used on oceanography is the Celcius scale (degrees C) such that: T = t + 273.15, where T is in oK and t is in oC. Temperature scales have changed over the years (in 1948, 1968 and most recently in 1990) as various benchmark values have been changed. For the oceanographic temperature range (-2 to 35 oC), temperature is now based on electrical resistance measurements of a pure platinum wire relative to the resistance at the triple point of water, which is a temperature value at which solid, liquid and vapor phases are in equilibrium at a standard atmosphere. Other benchmarks and the resistance ratios are given below: Triple point, mercury Triple point, water Melting point, Gallium Freezing point, Indium Temperature oC -38.8344 0.01 29.7646 156.5985 Wr 0.84414211 1.00000000 1.11813889 1.60980185 Wr=R(t90)/R(273.16 oK) is the resistance ratio of pure platinum for the t90 temperature scale relative to the triple point of pure water. For the oceanographic range, t90 = 0.010015 + 250.7140(Wr-1) + 9.71421(Wr-1) 2 The difference between the ‘old’ (1968) temperature scale (t68) and the ‘new’ (t90) is small, basically showing that water now boils at 99.97 oC not at 100! It can be written as t90=0.99976*t68 Most formulae for water properties (e.g. EOS1980, PSS1978) were distributed before this temperature change occurred and to be formally correct, they should have their t90 temperatures changed to the t68 scale before using them. In this course, we will usually use the symbol T to represent t90, unless units are specifically given as oK. Some representative profiles of temperature and salinity vs. depth are given below. The region of rapid temperature change with depth due to seasonal heating is called the “seasonal thermocline”. It lies above a permanent thermocline, which divides the upper and deep parts of the ocean. Images removed due to copyright concerns. Pressure Pressure is force/unit area acting on a surface. It has several units, with conventional units different in meteorology and oceanography. The Standard International (SI) units are based on the MKS (meter-kilogram-second) and is the Pascal. 1 Pascal = 1 newton/m2, where 1 Newton = 1 kg m / s2, making 1 Pascal = 1 kg / m s2 . Other units commonly uses are based on the Bar, where 1 Bar = 105 Pascal 1 mbar 10-3 bar = 102 pascal = 1 hectopascal, 1 dbar = 10-1 bar = 104 pascal. Pressure at the bottom of the atmosphere is 1.013 bar or 1013 mbar. Meteorologists commonly use millibars as pressure units and oceanographers use decibars because the additional pressure under a layer of water that is 1 meter high is approximately 1 dbar. We generally use gauge pressure, or the departure of pressure from atmospheric values at sea level. Just to make things more complicated, pressure is often quoted in terms of cm or inches of mercury in a manometer, where a standard atmosphere (1013 mbar) will raise a column of mercury a height 76 cm. Pressure measuring instruments can generally be calibrated by adding fixed masses that depress a fluid column a known amount, given that one can independently measure or determine the local acceleration of gravity! Short digression on pressure: Consider the diagram at the right: A column of water of density ρ and height h is resting. The column has a cross-sectional area A. The pressure at the top of the column is Pt and at the bottom, Pb. The Pressure at the bottom can be expressed as the total force per unit area on the bottom surface or ρ h (p1) Pb = (ρAh)g/A + Pt = ρgh + Pt , where (ρAh) is the mass of fluid & g is the acceleration of gravity. For small changes in depth, h = -δz, and Pb - Pt = δP, the above equation can be written in differential form as: (p2) δP/δz = -ρg , where we have inserted the sign convention that z is positive upward. This is known as the hydrostatic balance & is one of the most important relations in the ocean, where for most low frequency changes, it is a reasonable approximation of the force balance in the vertical. For a column of saltwater with a density of 1025 kg/m3 that is 10 m high with a gravity of 9.81 m/s2, using (p1) we get: δP = (1025)(9.81)(10) ~ 105 Pa, which is the pressure at the bottom of the atmosphere. Thus, the weight of the entire atmosphere is equivalent to 10 m of seawater! Mercury, which has a specific gravity of 13.6, or a density of 13.6 times that of pure water, would produce the same pressure at the bottom of a column that is: h = 105 Pa / (13600 kg/m3) / (9.81 m/s2 ) = 0.754 m. With a sea level pressure of 1.01 Bar, this would give 0.76m. A mercury-filled tube, sealed at one end and evacuated of air on that end, open to the atmosphere at the other is called a manometer and is one of the easiest ways of routinely and accurately measuring atmospheric pressure. sealed open 0.76m Adiabatic Lapse Rate & Potential Temperature If a layer of fluid is completely mixed, then when 2 parcels of fluid from anywhere in the layer are brought together at the same pressure, their properties are indistinguishable. The parcels must all have constant entropy per unit mass, η. This is expressed thermodynamically as follows: dη = ∂η dT + ∂η dp = 0, or ∂p ∂T dT dp = ( T ∂v ) ∂T = Γ, where C p ≡ ∂η , ∂η ≡ − ∂v T ∂T ∂p ∂T Cp where T is temperature (oK), ∂v/∂T is the change in specific volume (inverse of density) with respect to temperature, Cp is heat capacity at constant pressure, and Γ is the adiabatic lapse rate, or rate at which temperature will change in the vertical in an otherwise vertically mixed layer of fluid. It is often explained in terms of the compressiblility of air or seawater, but as you can see from the above, it does not directly come from the compressibility (∂v/∂p), but from the change in volume with temperature. At the surface of the earth in the lower atmosphere and in the deep ocean, the following are approximate values for Γ: Lower atmosphere: -10oC / 1000m increase in height Deep Ocean: -0.1 oC / 1000m decrease in depth This is most common to those living near mountains who can move upward to cooler temperatures by ascending the mountain even in a well-mixed lower atmosphere. In the ocean it is most evident in the gradual increase in temperature with increasing depth in the deep ocean. Because of the nonconservative aspect of temperature, we often use potential temperature, which is the temperature of a fluid parcel that is moved adiabatically from an initial pressure of pi to a reference pressure pr. It is expressed as follows: pr θ = t i + ∫ Γdp , where Γ is the lapse rate and ti is the initial temperature. p The diagram at the right is taken from Pickard & Emery (who took it from elsewhere) and shows the ‘classic’ picture of the difference between temperature and potential temperature over a deep trench (Mindanao). On the Image removed due to copyright left, temperature increases concerns. with depth and density anomaloy (using in situ temperature) decreases with increasing depth and suggest a ‘tongue’ of cooler water flowing to the left, over the sill at the right. Potential temperature and potential density anomaly (right panels) correctly show cooler deep water flowing over the sill and into the abyss with stable stratification above. Density Various different ways are used to describe the density of seawater and its relation to the basic field variables of temperature, salinity and pressure. σ = ρ − 1000 kg/m3 = σ(s,t,p) density anomaly v = 1/ ρ = v(s,t,p) specific volume δ = v(s,t,p) - v(35,0,p) specific volume anomaly σθ = σ(s,θ ,p,pr) potential density [σ2= σ(s,θ ,p,2000)] Usually density is plotted/examined at fixed pressures so that σθ is much more commonly than σ. The internationally used equation of state of seawater was suggested by Millero and accepted in 1980 (EOS80). The density of air at atmospheric pressure is approximately 1.2 kg/m3, nearly a thousand times less than seawater. Sound Speed The speed of sound, c, in a fluid is defined as: c-2 = (∂ρ /∂p)η, where the usual notation above applies and the change of density with pressure (related to the inverse of the compressibility) is determined at constant entropy. Values of sound speed (t=15 oC, p = sea level) in air (340 m/s) and water (1500 m/s) are quite different and c has the property that it increases with both t and p. In the ocean, because p increases with depth and t decreases with depth, one often sees a sound velocity minimum in the water column as sketched below: 1450 1000m depth 1500 1550 m/s Sound velocity minimum or sound channel: whales use it for long distance communication! 2000m In the following figure (taken from Pickard & Emery) an example of a sound velocity profile is given for a North Pacific location in which (upper panel) temperature and salinity variations are plotted vs. depth (left), the sound velocity dependence due to temperature and pressure (center) and the resultant sound speed profile (right) are indicated. In the lower panel(s), near surface and deeper effects of sound speed variation on propagation of rays of sound are shown. Note how, in the lowest plot, sound tends to be “channeled” in a region defined by the sound velocity minimum. This sound channel enables longdistance communication by whales, and has been exploited by oceanographers [and the military] for some time. Dynamic Height or Geopotential Anomaly Under action of gravity, a geopotential Φ, can be defined as the work done per unit mass to move a particle a distance dz, where –z is the direction of gravity. dΦ = g dz, z Φ( z) = Φ 0 + ∫ g dz 0 Recalling the hydrostatic balance (from the discussion of pressure), dp = − ρgdz; − vdp = gdz = dΦ, thus P P P 0 0 0 Φ ( P ) = Φ (0) − ∫ α 0 dp − ∫ δdp = Φ (0) − ∫ α 0 dp − D( p ), where P D ( p ) ≡ ∫ δ dp 0 D(p) is “dynamic height” or geopotential anomaly and it contains all of the horizontal and vertical variations of density in the fluid. The term proportional to α0 is of little dynamic consequence and the term at the ocean surface, Φ0, is a depth independent part of the geopotential or dynamic height that will need to be evaluated based on considerations other than density (or specific volume anomaly). The MKS units for geopotential anomaly or dynamic height are m2/s2, but common usage gives values of dynamic height in “dynamic meters”, which is equivalent to 10 m2/s2. Heat Capacity The amount of heat needed to raise the temperature per unit mass of a substance a temperature ∆T = 1 oK at constant pressure is heat capacity, Cp. Some typical values are as follows: Ocean water: Air Granite Cp= 4.2 x 10³ joules/kg/ oK Cp= 103 joules/kg/ oK Cp= 0.84 x 10³ joules/kg/ oK ρCp=4.2 x 10⁶ joules/m3/ oK ρCp=1.2 x 10³ joules/ m3/ oK ρCp=2.3 x 10⁶ joules/m3/ oK If one multiplies the heat capacity times the density of each of the above ρCp, one gets the third column, which is a measure of the heat capacity of one m3 of the substance. Reference: Fofonoff, in The Sea, Vol. 1: Physical Properties of Seawater.


