Document 13497137
advertisement
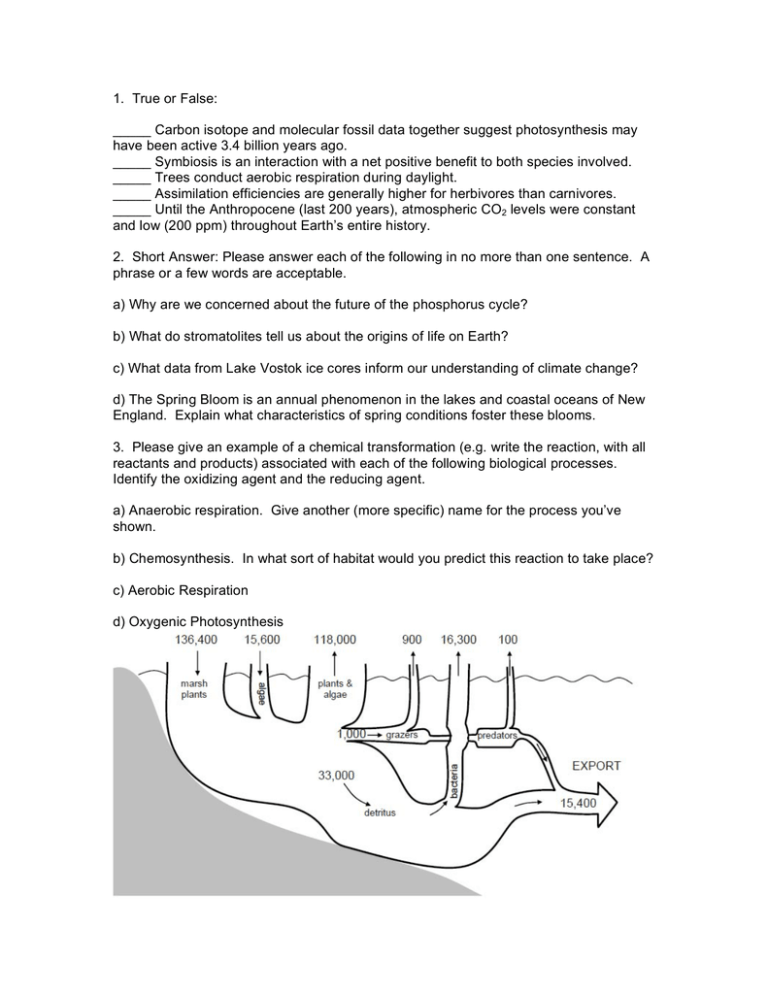
1. True or False: _____ Carbon isotope and molecular fossil data together suggest photosynthesis may have been active 3.4 billion years ago. _____ Symbiosis is an interaction with a net positive benefit to both species involved. _____ Trees conduct aerobic respiration during daylight. _____ Assimilation efficiencies are generally higher for herbivores than carnivores. _____ Until the Anthropocene (last 200 years), atmospheric CO2 levels were constant and low (200 ppm) throughout Earth’s entire history. 2. Short Answer: Please answer each of the following in no more than one sentence. A phrase or a few words are acceptable. a) Why are we concerned about the future of the phosphorus cycle? b) What do stromatolites tell us about the origins of life on Earth? c) What data from Lake Vostok ice cores inform our understanding of climate change? d) The Spring Bloom is an annual phenomenon in the lakes and coastal oceans of New England. Explain what characteristics of spring conditions foster these blooms. 3. Please give an example of a chemical transformation (e.g. write the reaction, with all reactants and products) associated with each of the following biological processes. Identify the oxidizing agent and the reducing agent. a) Anaerobic respiration. Give another (more specific) name for the process you’ve shown. b) Chemosynthesis. In what sort of habitat would you predict this reaction to take place? c) Aerobic Respiration d) Oxygenic Photosynthesis 4. Above is the energy flow diagram for a Georgia salt marsh (gC m-2 yr-1). a) Calculate the gross primary production (GPP), net primary production (NPP), and net community production (NCP) for the entire marsh ecosystem. Show all your work. b) About half of the NPP is exported by tides into surrounding marine systems in the form of organisms, particulate detritus and dissolved organic material. What is the fate of the NPP that is not respired and not exported? (3pts) c) How many gC m-2 yr-1 experience the fate described in part b.? (2 pts) 5. Identify which member of each of the following pairs, in general, has the greatest diversity of species. Defend your answer with a sentence or two. a) A meadow with a Simpson’s Index of 0.215 or a meadow with a Simpson’s index of 0.618? b) A large island close to the mainland, or a small island far from the mainland (both at equilibrium)? Provide two reasons. (Hint: you may use a graph in your answer.) c) A forest at 10°N latitude (near the equator) or a forest at 70°N latitude (near the pole)? d) An ecosystem with high gross primary productivity, or an ecosystem with low gross primary productivity? Bonus: Is “sustainable growth” ever possible? Defend your response using information from class materials. Begin with a one-sentence definition of sustainability. 6. The Lotka-Volterra Competition Model is: $ K " N1 " #N 2 ' dN1 = r1N1& 1 ) dt K1 % ( ! $ K " N 2 " #N1 ' dN 2 = r2 N 2 & 2 ) dt K2 % ( a) According to the model, there are four possible outcomes with respect to two competing species, N1 and N2. Draw the four different possible equilibrium plots of N2 vs. ! N1 that show these outcomes. For each plot, label the axes, show the x and y intercepts for the isoclines, and clearly label the equilibrium outcome. b) List three of the assumptions of this model. c) In one sentence, state the Competitive Exclusion Principle. d) Are all of your plots above completely consistent with the competitive exclusion principle? Which ones? Why or why not? If not, suggest some ecological reasons for why this inconsistency might occur. 7. Imagine that you are studying the effects of red-tailed hawk predation on the starling population of MIT’s west campus. Suppose that hawk and starling populations are governed by the following Lotka-Volterra predation-prey equations: dV = 0.1V " 0.0005PV dt ! dP = 0.001VP " 0.3P dt a) If initial population sizes are 100 hawks and 200 starlings, what are the short-term population dynamics (e.g. population trajectories of hawks and starlings) predicted by the model? ! b) Imagine that the hawk’s response to starlings is governed by the following Holling curve. Label the axes of the curve. What type of Holling Curve (I, II, or III) is this? Identify the regions of the curve where the hawk is limited by search time. Identify the regions where the hawk is limited by handling time. c) Imagine that the population of MIT pigeons has increased due to sympathetic feeding by campus visitors. Because the pigeons are slower and juicier, the hawks decide to hunt them, instead. What new Holling Response Curve will the hawks show when hunting starlings? Why? d) Given that starlings eat insects and insects eat grass, what trophic level do you expect the hawk to be at if it eats only starlings? e) Given that pigeons eat seeds, what trophic level do you expect the hawk to be at if its diet is 70% pigeons and 30% starlings? f) If you assume a 10% trophic transfer efficiency in all links of the food web, how much primary productivity (in kg) would it take to make a 3 kg red-tailed hawk that eats only starlings? 8. Over the past 200 years, the human population on Earth has been in the process of a “demographic transition”, during which the population of humans has increased dramatically. a) What are the underlying causes of the population explosion that occurs during a demographic transition? Sketch the graph, in terms of births per person and deaths per person, as a function of time. b) What technological developments are responsible for the shapes of these curves? c) Sketch the age distribution (number of people in different age groups) you would expect to see in (1) a population that is growing rapidly, and (2) a population that is just replacing itself. MIT OpenCourseWare http://ocw.mit.edu 1.018J / 7.30J Ecology I: The Earth Fall 2009 For information about citing these materials or our Terms of Use, visit: http://ocw.mit.edu/terms.
