Structures - Experiment 3B - How to...
advertisement
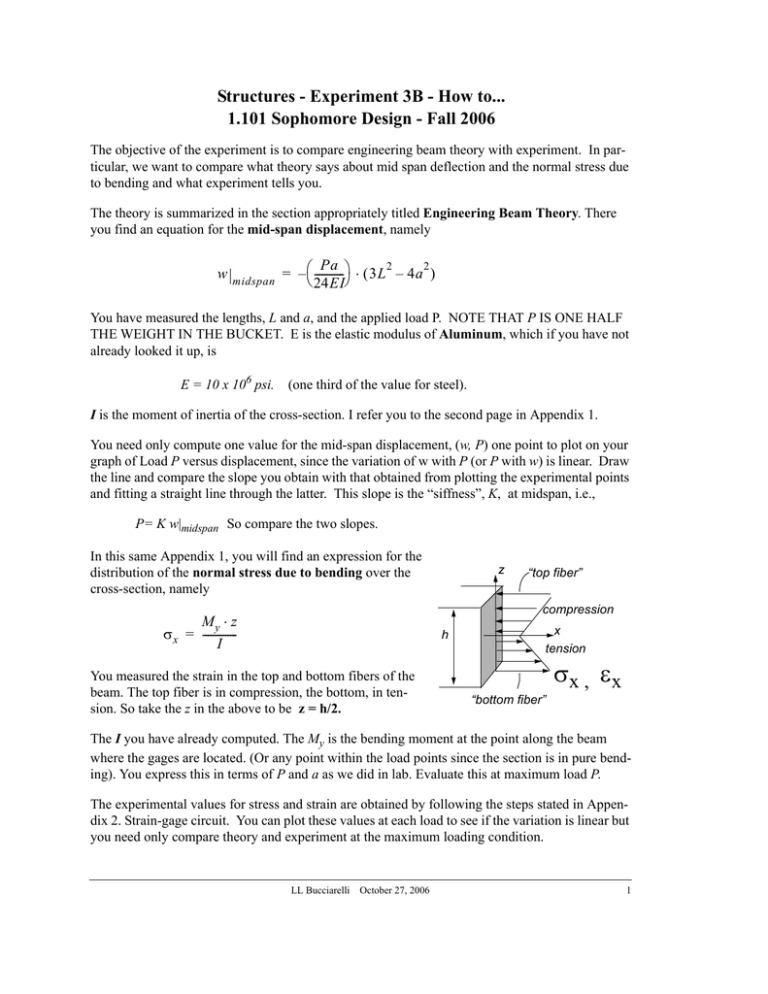
Structures - Experiment 3B - How to... 1.101 Sophomore Design - Fall 2006 The objective of the experiment is to compare engineering beam theory with experiment. In par ticular, we want to compare what theory says about mid span deflection and the normal stress due to bending and what experiment tells you. The theory is summarized in the section appropriately titled Engineering Beam Theory. There you find an equation for the mid-span displacement, namely w midspan Pa 2 2 = – ⎛ ------------⎞ ⋅ (3L – 4a ) ⎝ 24EI⎠ You have measured the lengths, L and a, and the applied load P. NOTE THAT P IS ONE HALF THE WEIGHT IN THE BUCKET. E is the elastic modulus of Aluminum, which if you have not already looked it up, is E = 10 x 106 psi. (one third of the value for steel). I is the moment of inertia of the cross-section. I refer you to the second page in Appendix 1. You need only compute one value for the mid-span displacement, (w, P) one point to plot on your graph of Load P versus displacement, since the variation of w with P (or P with w) is linear. Draw the line and compare the slope you obtain with that obtained from plotting the experimental points and fitting a straight line through the latter. This slope is the “siffness”, K, at midspan, i.e., P= K w|midspan So compare the two slopes. In this same Appendix 1, you will find an expression for the distribution of the normal stress due to bending over the cross-section, namely z “top fiber” compression My ⋅ z σ x = -------------I h You measured the strain in the top and bottom fibers of the beam. The top fiber is in compression, the bottom, in tension. So take the z in the above to be z = h/2. x tension σx , ε x “bottom fiber” The I you have already computed. The My is the bending moment at the point along the beam where the gages are located. (Or any point within the load points since the section is in pure bend ing). You express this in terms of P and a as we did in lab. Evaluate this at maximum load P. The experimental values for stress and strain are obtained by following the steps stated in Appen dix 2. Strain-gage circuit. You can plot these values at each load to see if the variation is linear but you need only compare theory and experiment at the maximum loading condition. LL Bucciarelli October 27, 2006 1
