1.101 Structures Lab. Fall 2005 Summary of Truss Tests
advertisement
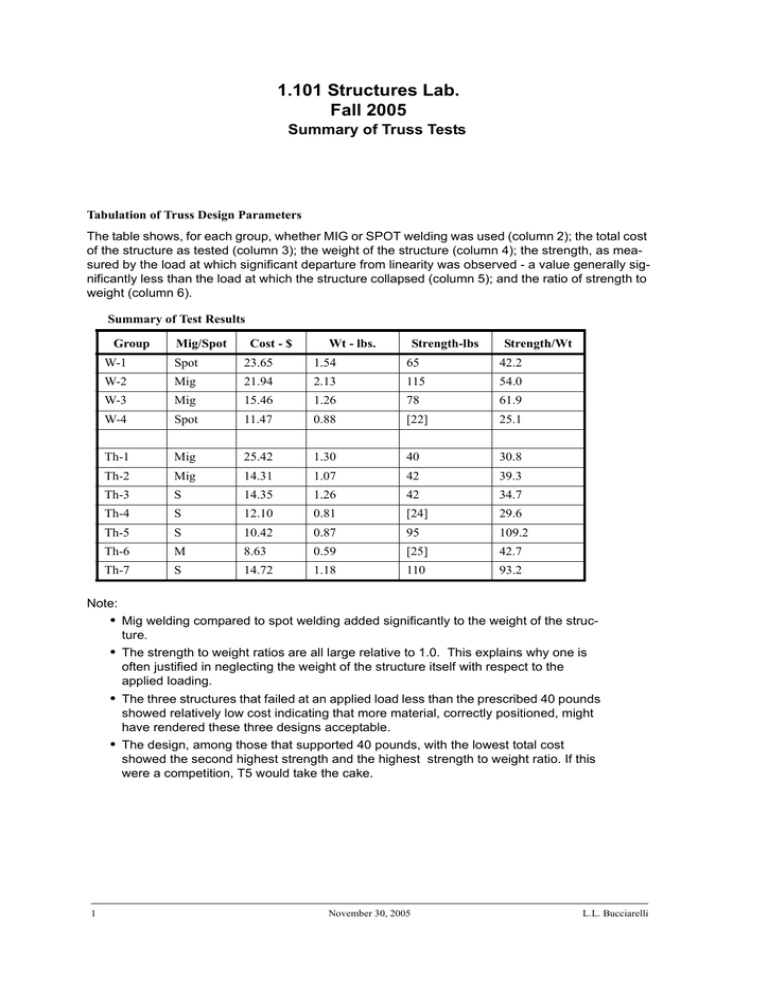
1.101 Structures Lab. Fall 2005 Summary of Truss Tests Tabulation of Truss Design Parameters The table shows, for each group, whether MIG or SPOT welding was used (column 2); the total cost of the structure as tested (column 3); the weight of the structure (column 4); the strength, as mea sured by the load at which significant departure from linearity was observed - a value generally sig nificantly less than the load at which the structure collapsed (column 5); and the ratio of strength to weight (column 6). Summary of Test Results Group Mig/Spot Cost - $ Wt - lbs. Strength-lbs Strength/Wt W-1 Spot 23.65 1.54 65 42.2 W-2 Mig 21.94 2.13 115 54.0 W-3 Mig 15.46 1.26 78 61.9 W-4 Spot 11.47 0.88 [22] 25.1 Th-1 Mig 25.42 1.30 40 30.8 Th-2 Mig 14.31 1.07 42 39.3 Th-3 S 14.35 1.26 42 34.7 Th-4 S 12.10 0.81 [24] 29.6 Th-5 S 10.42 0.87 95 109.2 Th-6 M 8.63 0.59 [25] 42.7 Th-7 S 14.72 1.18 110 93.2 Note: • Mig welding compared to spot welding added significantly to the weight of the struc ture. • The strength to weight ratios are all large relative to 1.0. This explains why one is often justified in neglecting the weight of the structure itself with respect to the applied loading. • The three structures that failed at an applied load less than the prescribed 40 pounds showed relatively low cost indicating that more material, correctly positioned, might have rendered these three designs acceptable. • The design, among those that supported 40 pounds, with the lowest total cost showed the second highest strength and the highest strength to weight ratio. If this were a competition, T5 would take the cake. 1 November 30, 2005 L.L. Bucciarelli The plot below displays these results in graphic form: MIG welded SPOT welded 120 T5 110 100 T7 Strength/Weight Ratio 90 80 70 W3 60 W2 50 T6 T2 40 T4 30 T1 W1 T3 W4 20 10 10 20 30 40 50 60 70 80 90 100 110 120 Strength (pounds) Relative size of circle or square indicates relative cost. 2 November 30, 2005 L.L. Bucciarelli
