Spring 2006 Process Dynamics, Operations, and Control 10.450
advertisement
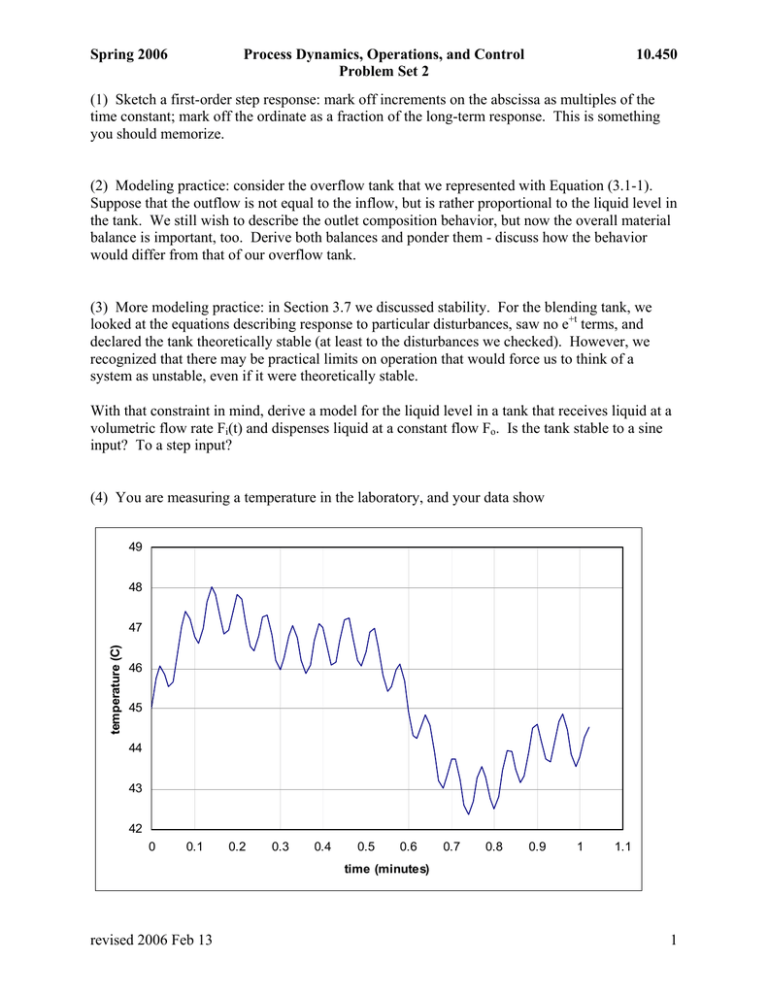
Spring 2006 Process Dynamics, Operations, and Control Problem Set 2 10.450 (1) Sketch a first-order step response: mark off increments on the abscissa as multiples of the time constant; mark off the ordinate as a fraction of the long-term response. This is something you should memorize. (2) Modeling practice: consider the overflow tank that we represented with Equation (3.1-1). Suppose that the outflow is not equal to the inflow, but is rather proportional to the liquid level in the tank. We still wish to describe the outlet composition behavior, but now the overall material balance is important, too. Derive both balances and ponder them - discuss how the behavior would differ from that of our overflow tank. (3) More modeling practice: in Section 3.7 we discussed stability. For the blending tank, we looked at the equations describing response to particular disturbances, saw no e+t terms, and declared the tank theoretically stable (at least to the disturbances we checked). However, we recognized that there may be practical limits on operation that would force us to think of a system as unstable, even if it were theoretically stable. With that constraint in mind, derive a model for the liquid level in a tank that receives liquid at a volumetric flow rate Fi(t) and dispenses liquid at a constant flow Fo. Is the tank stable to a sine input? To a step input? (4) You are measuring a temperature in the laboratory, and your data show 49 48 temperature (C) 47 46 45 44 43 42 0 0.1 0.2 0.3 0.4 0.5 0.6 0.7 0.8 0.9 1 1.1 time (minutes) revised 2006 Feb 13 1 Spring 2006 Process Dynamics, Operations, and Control Problem Set 2 10.450 You know the temperature is not really fluctuating that way, and you suspect that your instrument signal has been contaminated by some high-frequency noise. You decide to run the signal through a low-pass filter to remove the noise component. Suppose the filter is a first-order lag circuit. Draw its Bode plot so that you can see the effect on the instrument signal. What time constant should you use so that the amplitude ratio of the noise component is 0.01? Have you improved matters? (remember that the Bode plot is presented as a function of the radian frequency. How do you estimate radian frequencies from the time trace shown above?) revised 2006 Feb 13 2


