Quiz #5 Analysis of Variance
advertisement
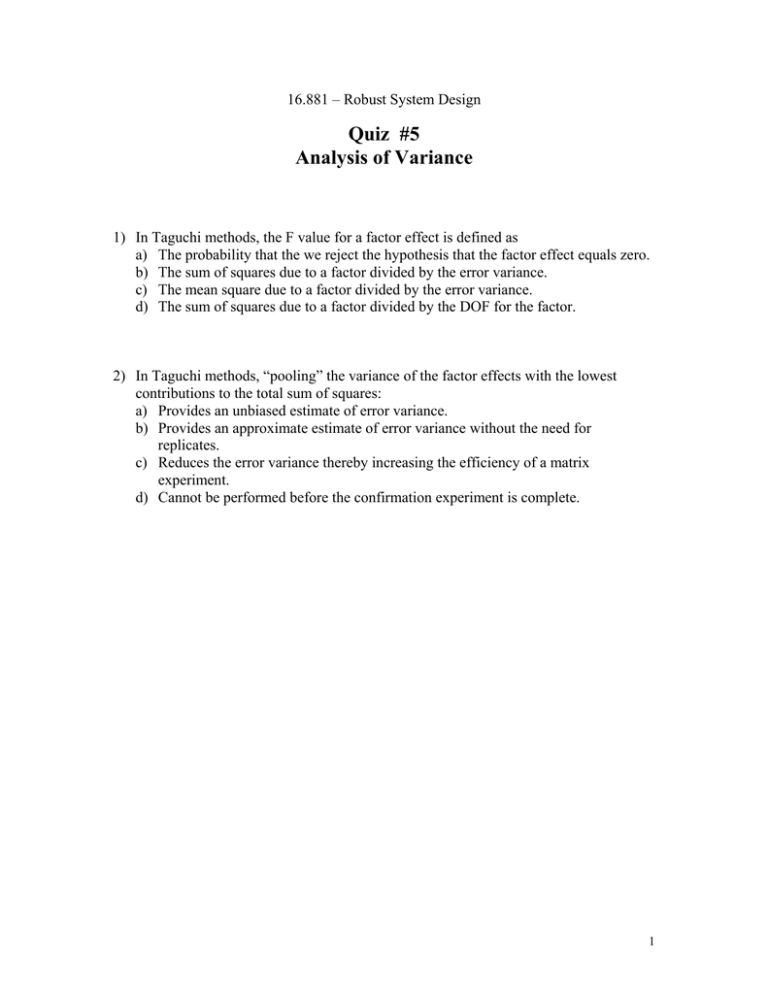
16.881 – Robust System Design Quiz #5 Analysis of Variance 1) In Taguchi methods, the F value for a factor effect is defined as a) The probability that the we reject the hypothesis that the factor effect equals zero. b) The sum of squares due to a factor divided by the error variance. c) The mean square due to a factor divided by the error variance. d) The sum of squares due to a factor divided by the DOF for the factor. 2) In Taguchi methods, “pooling” the variance of the factor effects with the lowest contributions to the total sum of squares: a) Provides an unbiased estimate of error variance. b) Provides an approximate estimate of error variance without the need for replicates. c) Reduces the error variance thereby increasing the efficiency of a matrix experiment. d) Cannot be performed before the confirmation experiment is complete. 1 The data below represent the results from an L9 with one noise factor in an outer array and three replicates. The table below the data represents the results of a one way (single factor) ANOVA (α=0.05) with the first row representing the first sample and the second row representing the second sample. Note that this is not the usual use of ANOVA in Taguchi methods. 3) What does the F crit value represent? 4) What conclusion can you draw from this analysis? 5) Explain a few differences between this analysis and a Taguchi style use of ANOVA. Experiment # 1 2 3 4 5 6 7 8 9 N1 #1 19 53.5 102.5 28 59 72.7 22 52.7 61 N1 #2 19.5 54.5 104.5 30.3 60.5 75.7 23.7 54.1 64.5 N1 #3 20.2 54 105 34 60.6 76.5 26 54.7 64 N2 #1 14 38.2 78.5 19 38.3 57.9 12.1 37.8 42.7 N2 #2 14 39.3 79.5 21.6 38.5 58.7 12.4 38 42.8 N2 #3 14.6 40.3 81.1 22 38.2 61.9 12.6 38 43.1 Anova: Single Factor SUMMARY Groups Row 1 Row 2 ANOVA Source of Variation Between Groups Within Groups Total Count Sum Average Variance 275.3 45.88333 76.26967 318.1 53.01667 125.0777 6 6 SS 152.6533 1006.737 1159.39 df MS F 1 152.6533 1.516318 10 100.6737 P-value F crit 0.24635064 4.964591 11 2
