Exam # 1 Review Topics §Chapter 1.
advertisement
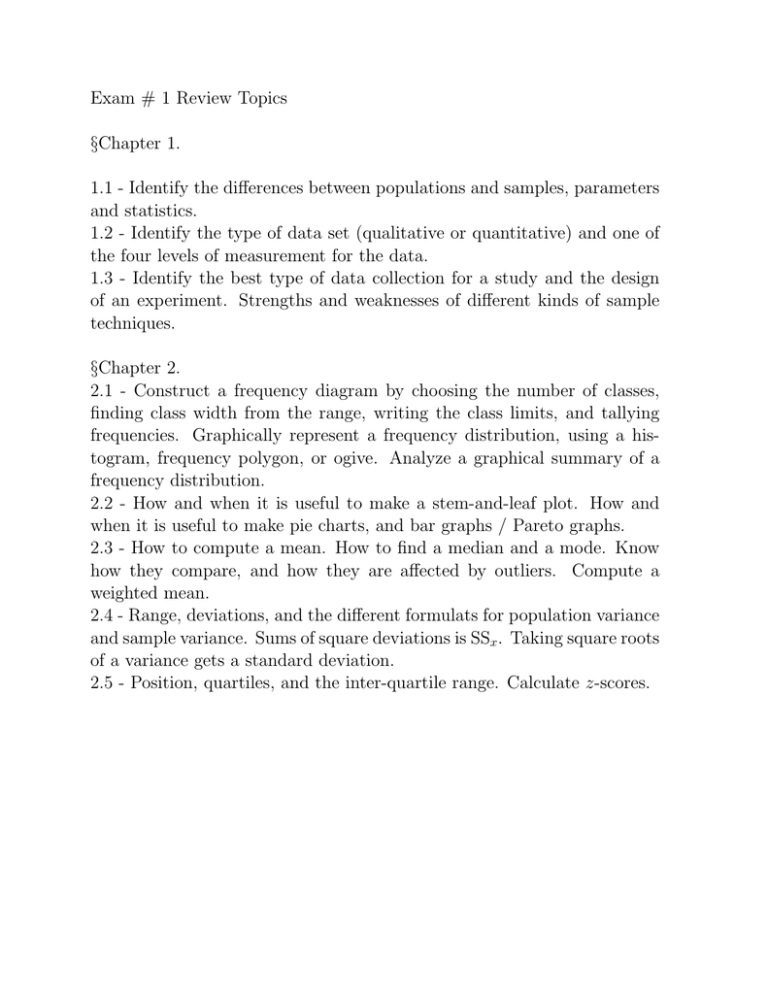
Exam # 1 Review Topics §Chapter 1. 1.1 - Identify the differences between populations and samples, parameters and statistics. 1.2 - Identify the type of data set (qualitative or quantitative) and one of the four levels of measurement for the data. 1.3 - Identify the best type of data collection for a study and the design of an experiment. Strengths and weaknesses of different kinds of sample techniques. §Chapter 2. 2.1 - Construct a frequency diagram by choosing the number of classes, finding class width from the range, writing the class limits, and tallying frequencies. Graphically represent a frequency distribution, using a histogram, frequency polygon, or ogive. Analyze a graphical summary of a frequency distribution. 2.2 - How and when it is useful to make a stem-and-leaf plot. How and when it is useful to make pie charts, and bar graphs / Pareto graphs. 2.3 - How to compute a mean. How to find a median and a mode. Know how they compare, and how they are affected by outliers. Compute a weighted mean. 2.4 - Range, deviations, and the different formulats for population variance and sample variance. Sums of square deviations is SSx . Taking square roots of a variance gets a standard deviation. 2.5 - Position, quartiles, and the inter-quartile range. Calculate z-scores.


