Chapter 1: Introduction
advertisement
Chapter 1, Introduction to Probability and Statistics
(1) Information comes with uncertainty. For example
whether a friend will call today
the time that a train will arrive
the time that a machine will fail
……
In order to study these phenomena, we need probability and statistics
(2) Probability and statistics is a study of uncertain events. It gives us a quantitative way
to measure the uncertainty.
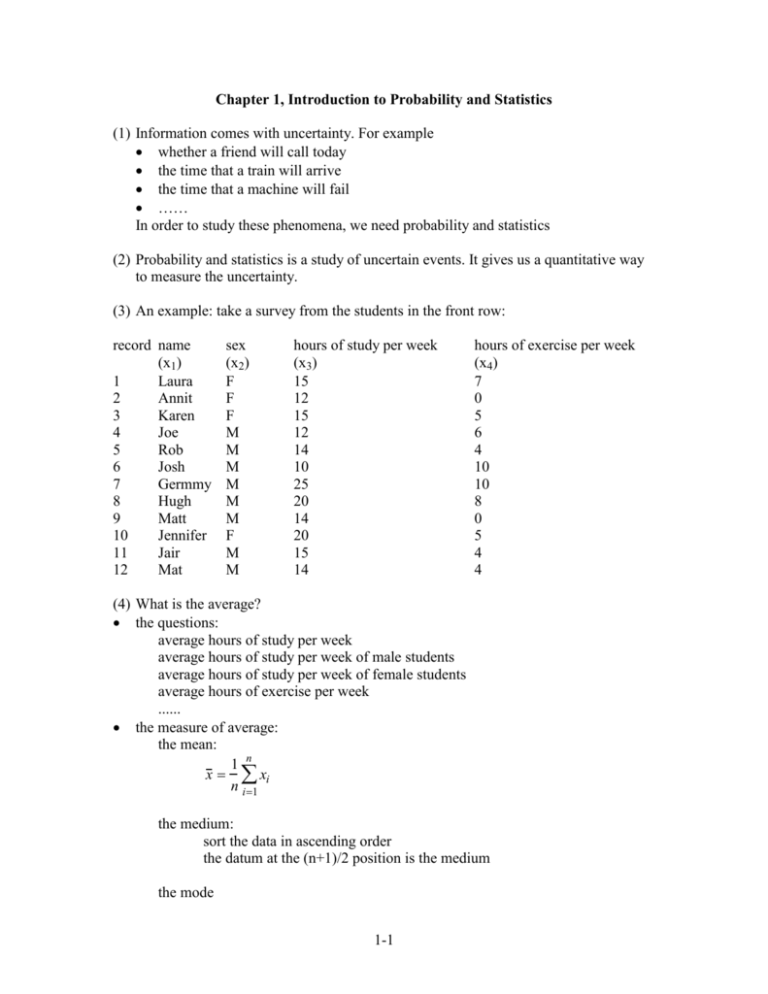
(3) An example: take a survey from the students in the front row:
record name
(x1)
1
Laura
2
Annit
3
Karen
4
Joe
5
Rob
6
Josh
7
Germmy
8
Hugh
9
Matt
10
Jennifer
11
Jair
12
Mat
sex
(x2)
F
F
F
M
M
M
M
M
M
F
M
M
hours of study per week
(x3)
15
12
15
12
14
10
25
20
14
20
15
14
hours of exercise per week
(x4)
7
0
5
6
4
10
10
8
0
5
4
4
(4) What is the average?
the questions:
average hours of study per week
average hours of study per week of male students
average hours of study per week of female students
average hours of exercise per week
......
the measure of average:
the mean:
1 n
x xi
n i1
the medium:
sort the data in ascending order
the datum at the (n+1)/2 position is the medium
the mode
1-1
arrange the data by incremental intervals
the position at which most data is concentrated is the mode
in the above example
x 3 = 15.5 (the mean hours of study per week)
x 4 = 5.25 (the mean hours of exercise per week)
also, for male student:
x 3M = 15.5
x 4M = 5.75
for the female student
x 3F = 15.5
x 4F = 4.25
note different data sets may have a same mean, for example:
A = {1, 1, 1, 1}
B = {2, 2, 0, 0}
but,
xA= xB=1
therefore, it is necessary to have another way to measure the uncertain events: variation.
(5) What is the variation?
the questions:
the variation of hours of study per week
the variation of hours of study per week of male students
......
the measure of variation
the variance
1 n
s2
xi x 2
n 1 i1
the standard deviation: s
the range:
r = max{xi} - min{xi}
in the above example:
sx3 = 4.19
sx4 = 3.25
sx3M = 4.78
sx4M = 3.45
sx3F = 3.32
sx4F = 2.98
1-2
observations:
- each student is somewhat different
- the statistics would be different (e.g., the mean and the variance of male and
female students)
- female students are more consistent than the male students (because of the
variation is small).
- note the above statistics are true ONLY for the 12 students in the front row. What about
the students in the entire class? the students in the University? ....
(6) Unanswered questions:
the questions:
- what is the hours of study per week of a students in the university? (prediction)
- is there any correlation between the hours of study and the hours of exercise?
(correlation)
- ......
the answers can be found by the probability and statistical theory, which we will learn in
the first part of this course.
1-3

