advertisement
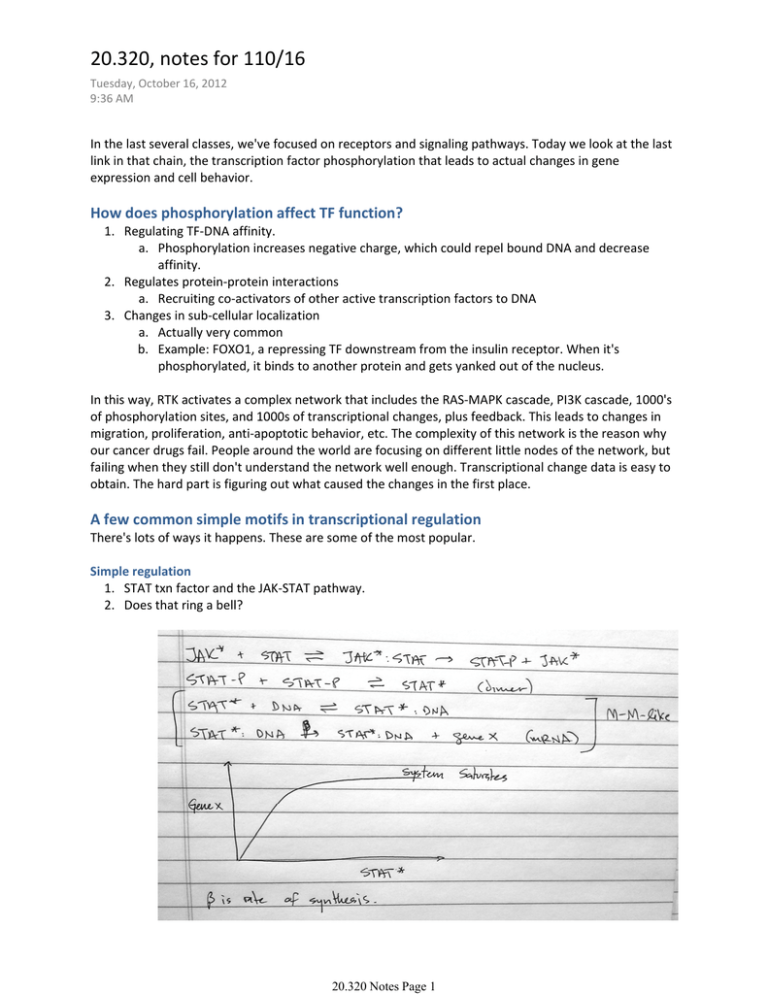
20.320, notes for 110/16 Tuesday, October 16, 2012 9:36 AM In the last several classes, we've focused on receptors and signaling pathways. Today we look at the last link in that chain, the transcription factor phosphorylation that leads to actual changes in gene expression and cell behavior. How does phosphorylation affect TF function? 1. Regulating TF‐DNA affinity. a. Phosphorylation increases negative charge, which could repel bound DNA and decrease affinity. 2. Regulates protein‐protein interactions a. Recruiting co‐activators of other active transcription factors to DNA 3. Changes in sub‐cellular localization a. Actually very common b. Example: FOXO1, a repressing TF downstream from the insulin receptor. When it's phosphorylated, it binds to another protein and gets yanked out of the nucleus. In this way, RTK activates a complex network that includes the RAS‐MAPK cascade, PI3K cascade, 1000's of phosphorylation sites, and 1000s of transcriptional changes, plus feedback. This leads to changes in migration, proliferation, anti‐apoptotic behavior, etc. The complexity of this network is the reason why our cancer drugs fail. People around the world are focusing on different little nodes of the network, but failing when they still don't understand the network well enough. Transcriptional change data is easy to obtain. The hard part is figuring out what caused the changes in the first place. A few common simple motifs in transcriptional regulation There's lots of ways it happens. These are some of the most popular. Simple regulation 1. STAT txn factor and the JAK‐STAT pathway. 2. Does that ring a bell? 20.320 Notes Page 1 These equations look a lot like M‐M equations, so we can wonder whether we can use the same simplified equations. People sometimes do, though the implications have not been thought through carefully. Note that we also have to think about deactivation and the mechanisms that might cause it (think degradation). And thus, the M‐M equations become: Negative auto‐regulation. In this case, the repressor binds to its own DNA and shuts off transcription. The crucial factor is how much DNA is bound by X at any given moment (because only that DNA will transcribe). 20.320 Notes Page 2 And so, all you need in order to exert careful control over the system is to change the values of alpha and beta. The big problem is that there's an inherent time delay in the system, and so the system is prone to oscillations. Positive auto‐regulation In this case, X creates its own active transcription factor, promoter, or the like. The result, of course, is strong positive feedback. 20.320 Notes Page 3 At the limit, this leads to a bimodal distribution (essentially a stepwise X‐vs‐signal graph). Population effects So how does this look when these systems are expressed in cell populations? Simple regulation of a behavior leads to a wide Gaussian distribution, because there is no control mechanism. A cell's behavior is a result of its particular combination of state variables (initial amounts of TFs, different levels of exposure to signals, etc.). Negative feedback helps create a tighter distribution, dampening differences, while positive feedback has the opposite effect. 20.320 Notes Page 4 MIT OpenCourseWare http://ocw.mit.edu 20.320 Analysis of Biomolecular and Cellular Systems Fall 2012 For information about citing these materials or our Terms of Use, visit: http://ocw.mit.edu/terms.

