The Argand Diagram
advertisement
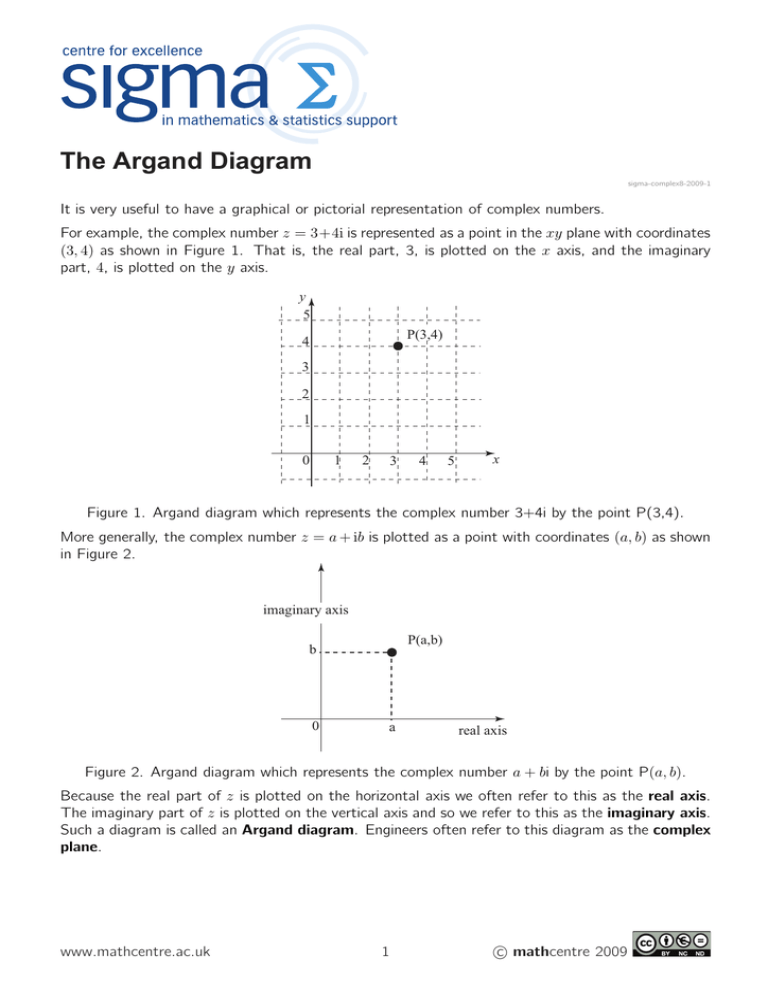
The Argand Diagram sigma-complex8-2009-1 It is very useful to have a graphical or pictorial representation of complex numbers. For example, the complex number z = 3+4i is represented as a point in the xy plane with coordinates (3, 4) as shown in Figure 1. That is, the real part, 3, is plotted on the x axis, and the imaginary part, 4, is plotted on the y axis. y 5 P(3,4) 4 3 2 1 1 0 2 3 4 5 x Figure 1. Argand diagram which represents the complex number 3+4i by the point P(3,4). More generally, the complex number z = a + ib is plotted as a point with coordinates (a, b) as shown in Figure 2. imaginary axis P(a,b) b 0 a real axis Figure 2. Argand diagram which represents the complex number a + bi by the point P(a, b). Because the real part of z is plotted on the horizontal axis we often refer to this as the real axis. The imaginary part of z is plotted on the vertical axis and so we refer to this as the imaginary axis. Such a diagram is called an Argand diagram. Engineers often refer to this diagram as the complex plane. www.mathcentre.ac.uk 1 c mathcentre 2009 Examples Plot the complex numbers z1 = 2 + 3i, z2 = −3 + 2i, z3 = −3 − 2i, z4 = 2 − 5i, z5 = 6, z6 = i on an Argand diagram. Solution The Argand diagram is shown in Figure 3. 5 4 2+3i 3 -3+2i 2 1 i -5 -4 -3 -3-2i -2 -1 0 -1 1 2 3 4 5 6 -2 -3 -4 2-5i -5 Figure 3. Argand diagram showing several complex numbers. Note that purely real numbers lie on the real axis. Purely imaginary numbers lie on the imaginary axis. Another observation is that complex conjugate pairs (such as −3 + 2i and −3 − 2i) lie symmetrically about the x axis. Finally, because every real number, a say, can be written as a complex number, a + 0i, that is as a complex number with a zero imaginary part, it follows that all real numbers are also complex numbers. As such we see that complex numbers form an extension of the sets of numbers with which we were already familiar. www.mathcentre.ac.uk 2 c mathcentre 2009
