Management Information Service MI service metrics
advertisement
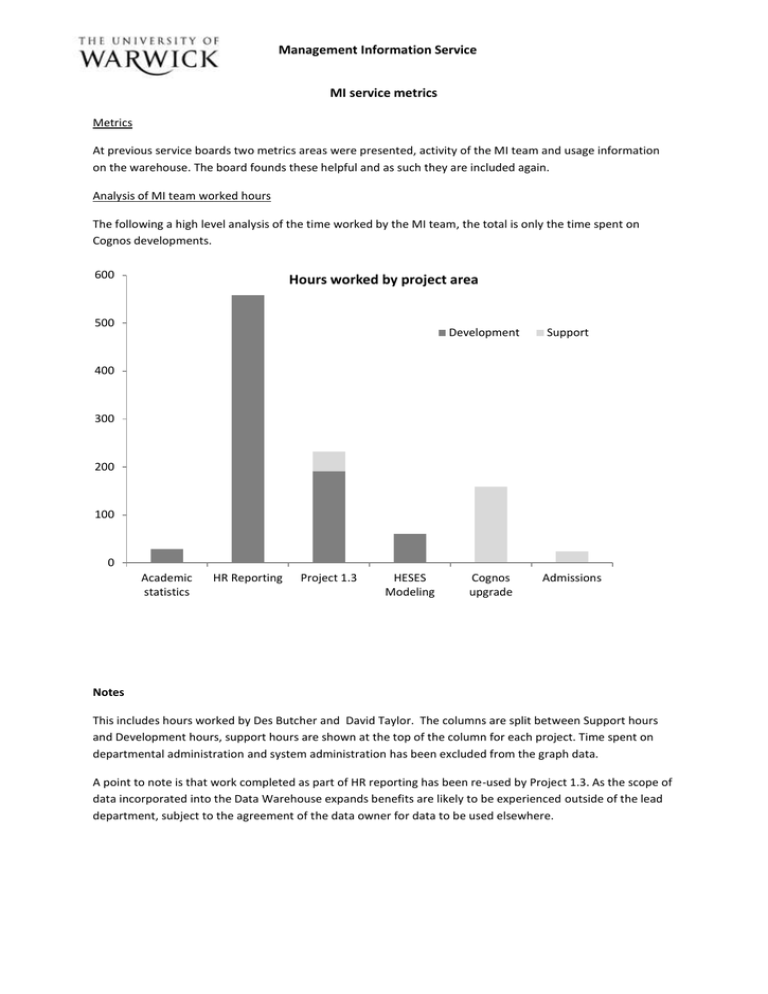
Management Information Service MI service metrics Metrics At previous service boards two metrics areas were presented, activity of the MI team and usage information on the warehouse. The board founds these helpful and as such they are included again. Analysis of MI team worked hours The following a high level analysis of the time worked by the MI team, the total is only the time spent on Cognos developments. 600 Hours worked by project area 500 Development Support 400 300 200 100 0 Academic statistics HR Reporting Project 1.3 HESES Modeling Cognos upgrade Admissions Notes This includes hours worked by Des Butcher and David Taylor. The columns are split between Support hours and Development hours, support hours are shown at the top of the column for each project. Time spent on departmental administration and system administration has been excluded from the graph data. A point to note is that work completed as part of HR reporting has been re-used by Project 1.3. As the scope of data incorporated into the Data Warehouse expands benefits are likely to be experienced outside of the lead department, subject to the agreement of the data owner for data to be used elsewhere. Management Information Service Service performance metrics To manage the performance of the MI service over time we are measuring the run time of a report at regular intervals during the day. The data collected will be used to identify any trends in service performance and investigate variances. The chart below is a statistical process control chart of the data gathered from running the standard report. The chart shows the run time of a report during the business day ( 07:17 am to 17:45 pm ) for the last month. Control chart - Report run time during business day Measured run time Average run time Upper control limit Lower control limit 18 16 14 Seconds 12 10 8 6 4 2 0 There are a set of rules which can be used to interpret the charted data, identifying series of readings which highlight a change in service performance which can be attributed to an assignable cause. The identification of these causes and their rectification or exploitation will allow us to manage consistent service performance over time. Management Information Service Report usage activity The following are charts of activity on the data warehouse broken down by report activity and the total usage of the warehouse. The summer period saw a drop off in activity, with the more recent months showing an increase in activity in the Warehouse. There have been few requests for the student plan and load reports although this is likely to change over the coming months as the planning round commences. 12 month report activity by reporting area Applications Student plan and load Project 1.3 RFC 2,000 1,500 1,000 500 0 12/08 03/09 06/09 09/09 Total report useage trend past 12 months 4,000 3,000 2,000 1,000 0 12/08 03/09 06/09 09/09 12/09
