Management Information Service Team utilisation and service usage metrics
advertisement
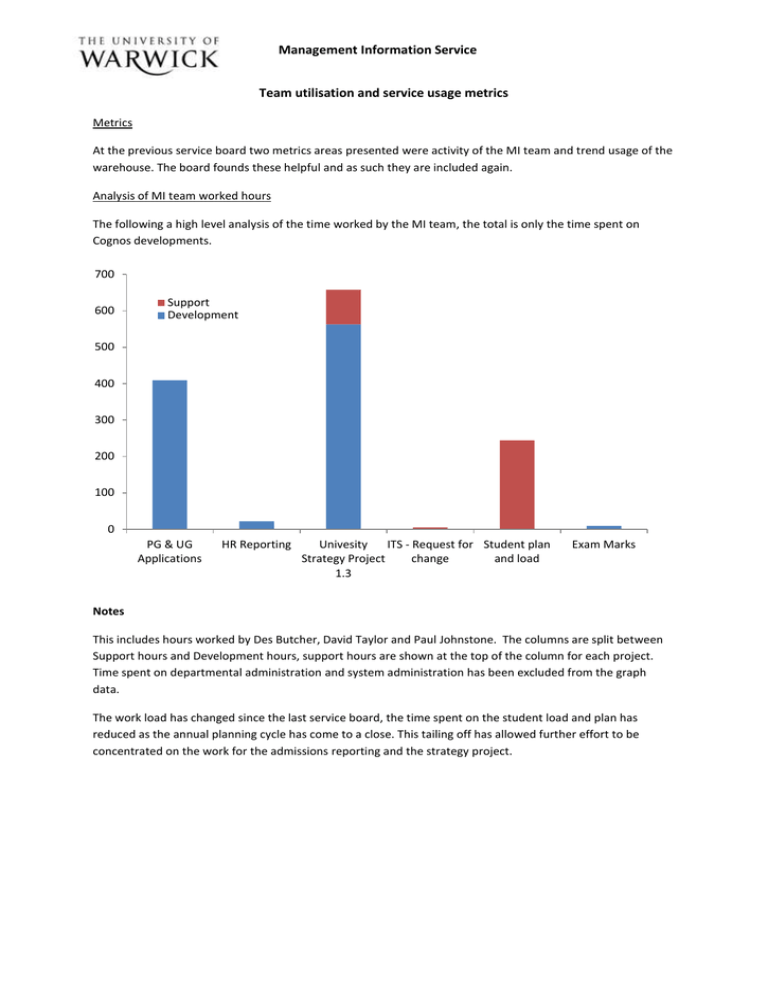
Management Information Service Team utilisation and service usage metrics Metrics At the previous service board two metrics areas presented were activity of the MI team and trend usage of the warehouse. The board founds these helpful and as such they are included again. Analysis of MI team worked hours The following a high level analysis of the time worked by the MI team, the total is only the time spent on Cognos developments. 700 600 Support Development 500 400 300 200 100 0 PG & UG Applications HR Reporting Univesity ITS - Request for Student plan Strategy Project change and load 1.3 Exam Marks Notes This includes hours worked by Des Butcher, David Taylor and Paul Johnstone. The columns are split between Support hours and Development hours, support hours are shown at the top of the column for each project. Time spent on departmental administration and system administration has been excluded from the graph data. The work load has changed since the last service board, the time spent on the student load and plan has reduced as the annual planning cycle has come to a close. This tailing off has allowed further effort to be concentrated on the work for the admissions reporting and the strategy project. Management Information Service Report usage activity The following is an analysis of report activity on the Warehouse broken down by report activity and the total usage of the warehouse. The overall trend has shown an increase in the usage of the warehouse, this rise can be attributed to the wider release of the applications reports and project 1.3 dashboard style report. YTD Monthly report activity broken down by reporting area 2,500 UG & PG applications University Strategy Project 1.3 Student plan and load 2,000 ITS - Request for change 1,500 1,000 500 0 01/01/2009 01/02/2009 01/03/2009 01/04/2009 01/05/2009 01/06/2009 Total report usage trend YTD 4,500 4,000 3,500 3,000 2,500 2,000 1,500 1,000 500 0 01/01/2009 01/02/2009 01/03/2009 01/04/2009 01/05/2009 01/06/2009
