Goals of Rivers Lectures Lecture 8 & 9: Intro to Geomorphology
advertisement
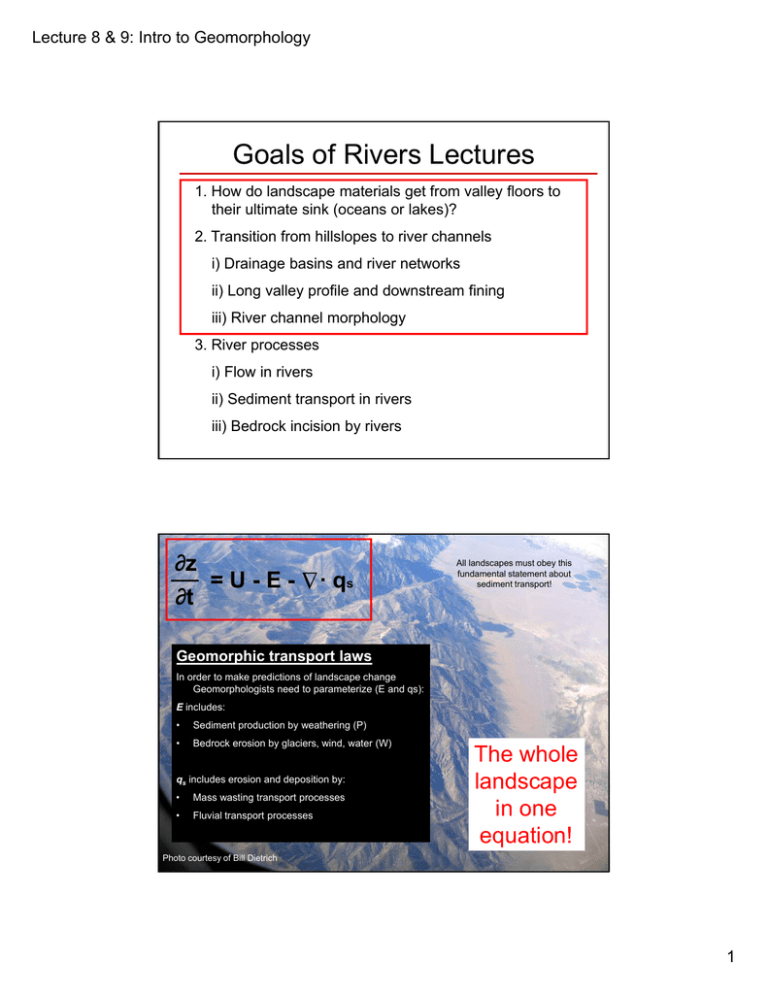
Lecture 8 & 9: Intro to Geomorphology Goals of Rivers Lectures 1. How do landscape materials get from valley floors to their ultimate sink (oceans or lakes)? 2. Transition from hillslopes to river channels i) Drainage basins and river networks ii) Long valley profile and downstream fining iii) River channel morphology 3. River processes i) Flow in rivers ii) Sediment transport in rivers iii) Bedrock incision by rivers ∆ ∂z =U-E∂t · qs All landscapes must obey this fundamental statement about sediment transport! Geomorphic transport laws In order to make predictions of landscape change Geomorphologists need to parameterize (E and qs): E includes: • Sediment production by weathering (P) • Bedrock erosion by glaciers, wind, water (W) qs includes erosion and deposition by: • Mass wasting transport processes • Fluvial transport processes The whole landscape in one equation! Photo courtesy of Bill Dietrich 1 Lecture 8 & 9: Intro to Geomorphology How do landscape materials get from valley floors to their ultimate sink (oceans or lakes)? Sediments are transported from source areas via river channels to the sea. Collectively these processes are called fluvial processes. Goals of Rivers Lectures 1. How do landscape materials get from valley floors to their ultimate sink (oceans or lakes)? 2. Transition from hillslopes to river channels i) Drainage basins and river networks ii) Long valley profile and downstream fining iii) River channel morphology 3. River processes i) Flow in rivers ii) Sediment transport in rivers iii) Bedrock incision by rivers 2 Lecture 8 & 9: Intro to Geomorphology Rivers are the conduits for water and sediment movement in the landscape between sources and sinks. Rivers are also conduits for the food web as well as nutrients and contaminant movement in the landscape. Thus understanding how water and sediment move through rivers is of grave importance to understanding ecology, population dynamics, and environmental chemistry. This idea is not currently well understood or accepted, simply because ecologists, biologists, and chemists are used to thinking at small-scale. Yet, understanding that various ‘sites’ are part of a functioning landscape and a water/sediment superhighway is beginning to take hold. Drainage basins Because rivers form these conduits, we can break the landscape into discrete units: drainage basins 3 Lecture 8 & 9: Intro to Geomorphology Structure of a drainage basin Alluvial zone Depositional zone Colluvial zone Alluvial vs. Colluvial Channels Alluvial Channels • Rivers flowing through their own deposits • Typically lowland river channels flowing in wide valleys • Transport Capacity ≤ Sediment Supply • Input ≥ Output 4 Lecture 8 & 9: Intro to Geomorphology Alluvial vs. Colluvial Channels Colluvial Channels • Rivers actively cutting into the landscape • Headwater channels that drain mountainous environments • Transport Capacity > Sediment Supply In mountainous environments, most of the drainage basin is made up of small steep channels. 5 Lecture 8 & 9: Intro to Geomorphology Organization of Drainage Basins There was a time when geomorphologists thought about river systems in terms of Magnitude and Stream Order Magnitude of a basin is the number of first order or “exterior links” in a catchment. Magnitude correctly emphasizes where the channel begins. Stream order is commonly done on nearly arbitrary network scales, and therefore means little. “Horton’s laws”, which are derived from analysis of stream orders, have no physical meaning. M=9 N= 2M-1 N= number of links (exterior + interior) Kirchner (Geology; 1993) correctly pointed out that stream order is an outcome of the ordering process and is statistically meaningless. The enduring quantitative measures of drainage basins: Hack’s Law D=∑L/A 6 Lecture 8 & 9: Intro to Geomorphology Hack’s Law: D = ∑ L / A Drainage density varies depending on local climate (frequency and magnitude of precipitation), vegetation patterns, and geology. Importance arises because: 1) It is a real measure of drainage basin structure, not dependent on ordering schemes. Q High D Low D 2) The time scales related to rainfall concentration and runoff are related to D. t 3) Can be used to define other useful geomorphic properties of the landscape: constant of channel maintenance and length of overland flow Length area L = 1.4A0.6 Hack’s Law: D = ∑ L / A constant of channel maintenance: length of overland flow: C=1/D=A/∑L LOF = 1 / 2D Basin area required to maintain one linear unit of channel Distance of water movement on a hillslope before it begins to channelize S. California Utah Indiana Igneous/ Meta. Sedimentary Sandstone 5.58 3.83 2.3 D (km/km2) 13.70 Virginia Metamorphic (m2/m) 73 179 261 435 LOF (m) 36 90 131 217 C 7 Lecture 8 & 9: Intro to Geomorphology What controls drainage density? Channel head: threshold transition between hillslope and channel processes Hortonian model for channel initiation When precipitation rate exceeds the infiltration rate, overland flow occurs. Channels develop when the erosive force of overland flow exceeds the resisting force. z x The resisting force is given by the weight of a grains resting on the surface of the slope + and cohesive forces (clay, veg, roots, etc.) 8 Lecture 8 & 9: Intro to Geomorphology Hortonian model for channel initiation gdS LOF τ = shear stress ρ = water density g = gravitational accel. h = flow depth z d x x Moving downslope, the volume of flowing water increases (and so does the slope), so the erosive force also increases until it can move sediment. Montgomery and Dietrich (Nature, 1988) Explored the problem of where channels begin by examining the relation between the slope and upslope source area for water and sediment at channel heads. They found a inverse slope between contributing area and slope – as slope increases, the drainage area declines (as in Hortonian model) Oregon So. Cal. No. Cal. But, they found that most channels are initiated at sites of landslides in steep terrain suggesting channels are initiated by hillslope processes not channel processes. 9 Lecture 8 & 9: Intro to Geomorphology Montgomery and Dietrich (Science, 1992) Oregon Coast Range N. California Downslope of channel head Upslope of channel head S. California Summary Threshold for channel initiation They also found that for a given slope, there is a threshold contributing area for channel initiation. Below the threshold, hillslope processes dominate. Above the threshold, channel processes dominate. Diffusive and advective landscape elements Starting at the crest of a hill, the drainage area increases with slope. At the hillslope-valley transition, the slope begins to declines and the drainage area increases (big rivers have small gradients). drainage area per contour length, a/b (m) 10000 Valleys 1000 100 Hillslopes 10 Convergent Divergent 1 0 0.2 0.4 0.6 0.8 1 1.2 1.4 gradient Dietrich et al. (PIG, 2003) 10 Lecture 8 & 9: Intro to Geomorphology Goals of Rivers Lectures 1. How do landscape materials get from valley floors to their ultimate sink (oceans or lakes)? 2. Transition from hillslopes to river channels i) Drainage basins and river networks ii) Long valley profile and downstream fining iii) River channel morphology 3. River processes i) Flow in rivers ii) Sediment transport in rivers iii) Bedrock incision by rivers Debris flow dominated 100 to 10% 10 to 2% Gravelbedded rivers 2 to 0.1% Abrupt transition Shallow flow over boulders Sand-bedded rivers <0.1% Depositional basin Slope 0 Grain-size Elevation Hypothetical long profile of a river Distance from drainage divide 22 Gravel-Sand Transition 11 Lecture 8 & 9: Intro to Geomorphology Debris flow dominated channels: Angshou River,Taiwan Colluvial channels (> 10% slope) Grading into transitional channels (2 - 10%) Transitional channels: Steep channels (Slope 2 - 10%) motivation Erlenbach Torrent Switzerland: 10% slope Finer, more mobile sediment Large, relatively immobile grains 12 Lecture 8 & 9: Intro to Geomorphology Transitional channels: Steep channels (Slope 2 - 10%) Boulder Cascade Transitional channels: Steep channels (Slope 2 - 10%) Step Pool Step Pool Step pool channel: Skunk Creek, CA 13 Lecture 8 & 9: Intro to Geomorphology Transitional channels: Steep channels (Slope 2 - 10%) Step Pool Step Pool River flow dominated channels: gravel-bedded channels (Slope 0.1 - 2%) Pool Bar Pool 14 Lecture 8 & 9: Intro to Geomorphology River flow dominated channels: gravel-bedded channels (Slope 0.1 - 2%) Bar Pool Pool Bar Bar Pool River flow dominated channels: gravel-bedded channels (Slope 0.1 - 2%) Channels lacking welldefined bedforms and instead displaying long reaches lacking pools. Due to low sediment supply? 15 Lecture 8 & 9: Intro to Geomorphology River flow dominated channels: gravel-bedded channels (Slope 0.1 - 2%) • Typically composed of multiple channels separated by bars • Weak (non-cohesive) bank materials Braided river: Quill Creek River flow dominated channels: gravel-bedded channels (Slope 0.1 - 2%) Braided river: Kicking Horse 16 Lecture 8 & 9: Intro to Geomorphology River flow dominated channels: gravel-bedded channels (Slope 0.1 - 2 %) • Wide, deep & sinuous channels • Typically multiple channels separated by vegetated islands • Laterally unstable • Fraser River is wandering between Hope and Mission, BC Vegetated Islands Anabranching Rivers: Yukon R. River flow dominated channels: sand-bedded channels (Slope < 0.1 %) Oxbow Cut Banks Point Bars Meandering River 17 Lecture 8 & 9: Intro to Geomorphology River flow dominated channels: sand-bedded channels (Slope < 0.1 %) • Typically single thread • Narrow, deep & sinuous • Low gradient with strong (cohesive) bank materials • Characterized by varying degrees of sinuosity Meandering River River flow dominated channels: Depositional channels (slope 0) Lena River Delta 18 Lecture 8 & 9: Intro to Geomorphology Controls on river bed grain-size Sklar and Dietrich (2001) Fraser River, BC 1400 Moose L. 800 600 400 McBride Mission Hope 1000 Sand Heads Bed Elevation (m) 1200 Chilcotin R. 200 0 0 200 400 600 800 1000 1200 1400 Distanceupstream upstreamofofSand the ocean Distance Heads (km) (km) Depositional channel Sand-bedded channel Gravel-bedded channel 19 Lecture 8 & 9: Intro to Geomorphology Fraser River: Bedrock canyon morphology Fraser River: Multi-thread gravel-bedded anabranching morphology Andre Zimmermann 40 Gravel-Sand Transition in Fraser River 20 Lecture 8 & 9: Intro to Geomorphology Fraser River: Single-thread sand-bedded ‘pseudo-meandering’ Mission Most of the water is not carried through the apex of the bends! Gravel-Sand Transition in Fraser River 41 Fraser River: Depositional delta New Westminster Vancouver YVR Surrey Richmond 42 Gravel-Sand Transition in Fraser River 21 Lecture 8 & 9: Intro to Geomorphology Goals of Rivers Lectures 1. How do landscape materials get from valley floors to their ultimate sink (oceans or lakes)? 2. Transition from hillslopes to river channels i) Drainage basins and river networks ii) Long valley profile and downstream fining iii) River channel morphology 3. River processes i) Flow in rivers ii) Sediment transport in rivers iii) Bedrock incision by rivers River cross‐section and bankfull flow The floodplain is that part of the river that is inundated whenever flow exceeds the bank height. The flow that is just contained within the river channel banks without flowing on to the floodplain is the bankfull flow. The return interval for bankfull flow is ever couple of years (1.5 – 2.5). Bankfull flow is the channel forming flow. 22 Lecture 8 & 9: Intro to Geomorphology Hydraulic Geometry of Rivers Width w = aQb Depth d = cQf Velocity U = kQm At‐a‐station: tells us the channel dimensions as flow changes at one cross‐section Downstream: tells us how channel dimensions change along the channel. 1964 Luna Leopold: served as Chief of the Hydrology Section of the USGS in the late 1950s and 1960s. There he had access to an enormous data set that gave the dimensions (width, depth) and river channel velocity at various discharges and along stream. Invented what we now call Hydraulic Geometry. Ted Hickin course notes 23 Lecture 8 & 9: Intro to Geomorphology At-A-Station Hydraulic Geometry of Rivers Squamish River Width w = aQb Depth d = cQf Velocity U = kQm b + f + m = 1 a x c x k = 1 Ted Hickin course notes 24 Lecture 8 & 9: Intro to Geomorphology Downstream Hydraulic Geometry of Rivers Width w = aQb Depth d = cQf Width (m) Depth (m) Velocity U = kQm Discharge (m3/s) Alluvial river channel planforms 25 Lecture 8 & 9: Intro to Geomorphology What controls river planform? Fine Sand & Silt Sand Gravel Interplay between sediment size, sediment supply and channel gradient Summary of downstream changes in rivers • Elevation and slope decline Boulders & Cobbles Church, Annual Reviews of Earth Science, 2005 Alluvial zone Depositional zone Colluvial zone • Rivers transition from bedrock to alluvial • The amount of stored alluvium increases • Bed material grain size declines with an abrupt transition between gravel and sand • Rivers get bigger (width, depth, velocity) 26 Lecture 8 & 9: Intro to Geomorphology Goals of Rivers Lectures 1. How do landscape materials get from valley floors to their ultimate sink (oceans or lakes)? 2. Transition from hillslopes to river channels i) Drainage basins and river networks ii) Long valley profile and downstream fining iii) River channel morphology 3. River processes i) Flow in rivers ii) Sediment transport in rivers iii) Bedrock incision by rivers River Processes • River channels are stable features in the landscape because of a balance between the downstream driving force (gravity) which causes flow and resistance to flow • This resistance to down-slope flow is communicated to the fluid via the generation of turbulent flow eddies at the boundary Resistance Elements • Turbulent eddies extract energy from the mean flow and convert it to turbulent energy maintaining the balance 27 Lecture 8 & 9: Intro to Geomorphology Driving force in a river: Discharge Resisting force: frictional drag Step Pool Dunes & Bars Ripples Gravel clusters and cells 28 Lecture 8 & 9: Intro to Geomorphology Flow Resistance in SandBedded Rivers Flow Resistance Equations In practice, flow resistance is often calculated in terms of its influence on velocity. Engineers and scientists have attempted to devise methods for calculating velocity for centuries. This has resulted in a number of expressions for the mean velocity in rivers: Manning Chezy DarcyWiesbach 1/2 gdS d 2/3S1/2 Cd 1 / 2 S 1 / 2 8 U n f Each equation includes the flow depth (d), the river slope (S) and a flow resistance coefficient (n, C, f ). 29 Lecture 8 & 9: Intro to Geomorphology Flow Resistance Equations A significant difference between these equations is that in the Manning Equation: U d 2/3S1/2 While in the Chezy and D-W equations: U d 1/2S1/2 The Manning equation is empirical (based on observations), so it is widely thought to have proportionality correct. Flow Resistance Equations There is a significant problem with the Manning and Chezy equations in that the coefficients have units (n = [L1/6] and C = [1/2]). This means that roughness is dependent on the size of the river, which we know is not correct. The Darcy-Weisbach Equation is increasing used to replace the Manning and Chezy. You can also modify the Manning or Chezy equations so that C or n is dependent on the river bed grain-size: d C 8 ks 1/ 6 g n 1 8 k s 1 / 6 g Where ks = 2 D90 in gravel-bedded channels, 2 D50 in flat sand-bedded rivers, and is proportional to the bedform size in rough sand-bedded rivers. Using the Manning or Chezy equation without an indexed coefficient! 30 Lecture 8 & 9: Intro to Geomorphology Balance between driving and resisting forces The balance between the resisting forces and driving forces in a river reach can be expressed mathematically by stating: Driving force (Fg) = Resisting force (Fd) Fd l w d Fg Driving force Fg mg sin ( d l w) g sin Balance between driving and resisting forces The resisting force is calculated as the shear stress exerted on the channel boundary: The channel boundary is the part of a river reach that is in contact with water Fd l Resisting force: w d Fg Fd [l ( 2d w)] 31 Lecture 8 & 9: Intro to Geomorphology Quantifying the Driving Force in Rivers By equating the driving resisting force to the resisting force, we can find an expression for the driving force (boundary shear stress): (dlw) g sin [l (2d w)] Solving for τ wd g sin 2d w Quantifying the Driving Force in Rivers (dlw) g sin [l (2d w)] Solving for τ wd g sin 2d w Defining the hydraulic radius: Boundary shear stress in rivers R wd 2d w d A = wd d w gR sin 32 Lecture 8 & 9: Intro to Geomorphology Quantifying the Driving Force in Rivers In most river channels, when the width is greater than ~20 times the depth, the hydraulic radius is within 10% of the depth: So: gd sin At slopes <10% or 5.7o, sin θ ≈ tan θ ≡ S So: gdS The force exerted on the bed by the flow is equal to the flow depth times the channel slope. We can use the boundary shear stress to predict sediment transport in rivers. Goals of Rivers Lectures 1. How do landscape materials get from valley floors to their ultimate sink (oceans or lakes)? 2. Transition from hillslopes to river channels i) Drainage basins and river networks ii) Long valley profile and downstream fining iii) River channel morphology 3. River processes i) Flow in rivers ii) Sediment transport in rivers iii) Bedrock incision by rivers 33 Lecture 8 & 9: Intro to Geomorphology Sediment Transport Mechanisms Suspension Saltation (Traction) Rolling Sliding Sediment Transport Measurement in Rivers Bedload Suspended sediment 34 Lecture 8 & 9: Intro to Geomorphology Mechanism and Measurement Discrepancy Suspension Saltation Rolling Sliding Sediment Transport in Rivers Church, Annual Reviews of Earth Science, 2005 35 Lecture 8 & 9: Intro to Geomorphology Predicting Sediment Transport in Rivers • We can predict bed material flux in rivers from an understanding of the physics of fluid flow. • This is because bed material flux is driven by the force applied to the river bed (boundary shear stress). • Predicting bed material sediment flux involves: 1. Establishing the entrainment and suspension thresholds 2. Predicting bedload transport 3. Predicting suspended sediment transport Calculation of the fluid shear stress (d) d Bierman and Montgomery, 2014 36 Lecture 8 & 9: Intro to Geomorphology = ρgdS = ρ u*2 (Pa) The Shields Curve Silt Sand Gravel D50 (mm) To establish the the bedload entrainment threshold, we use the Shields diagram to find (c). Then we determine if the fluid shear stress c. If so, bedload transport occurs. Predicting bedload transport in rivers We use a bedload transport equation to predict the amount of sediment moved in traction or saltation. There are dozens of bedload equations, but the simplest one (Meyer-Peter and Muller Equation) takes the form: q s 0.253( c )1.5 qs = sediment flux (sediment transport rate or sediment discharge) per unit width of the river [L2/T] 37 Lecture 8 & 9: Intro to Geomorphology The suspension threshold w Suspension No suspension w vs vs In order to move a particle into suspension, there must be a vertical fluid motion (w) away from the bed that is greater than the settling velocity of the sediment grain (vs). These vertical fluid motions come from turbulence. Research has shown that the vertical motions responsible for sediment suspension can be characterized by something called the shear velocity which is calculated from the shear stress as: u* w = ρgdS = ρ u*2 (Pa) The suspension threshold on the Shields curve Silt Sand Gravel D50 (mm) We can capture this idea on the Shields by drawing a line where the shear velocity (u*) is greater than the settling velocity of sediment particles (vs). If u* > vs, the sediment will be entrained from the bedload into suspension. 38 Lecture 8 & 9: Intro to Geomorphology Predicting suspended bed material load in rivers In order to predict suspended bed material sediment flux in rivers, we use the Rouse equation that has the following form: Relative height (z – a) / (h – a) Water surface (z = h) z c h z a ca z h a Ro Top of bedload layer (a) Relative concentration (C/Ca) The Rouse equation gives us the sediment concentration in the water column relative to the sediment concentration at the top of the bedload layer. Predicting suspended bed material load in rivers In order to predict suspended bed material sediment flux in rivers, we use the Rouse equation that has the following form: Relative height (z – a) / (h – a) Water surface (z = h) z c h z a ca z h a Ro Top of bedload layer (a) Relative concentration (C/Ca) Ro is the Rouse number (~vs / u*). When it is large, vs >> u*, so there is no suspension (Ro > 2.5). When it is small, vs < u*, so there is lots of suspension high up in the flow (Ro < 1). 39 Lecture 8 & 9: Intro to Geomorphology Predicting bed material load in rivers Water surface (z = h) By multiplying the concentration at any height above the bed by a velocity and a depth increment, we get sediment flux at a given height above the bed. Summing up vertically, we get the suspended bed material flux (per unit width of the river [L2/T]) z Top of bedload layer (a) Total bed material sediment flux (Qs) in a cross-section of a river is the sum of the bedload and the suspended bed material sediment flux per unit width of the river times the channel width. Qs = (qs-bedload + qs-ssbm)*width Predicting washload in rivers Fraser River at Agassiz Unfortunately, we cannot predict wash material load in rivers from physics because it is controlled by sediment supply from the hillslopes and not the capacity of the channel to caryy sediment. So geomorphologists usually rely on suspended sediment rating curves. q s Cq WATER DISCHARGE (m3/s) q = water flux per unit width of the river [L2/T] C = sediment concentration in water column [dimensionless) 40 Lecture 8 & 9: Intro to Geomorphology Goals of Rivers Lectures 1. How do landscape materials get from valley floors to their ultimate sink (oceans or lakes)? 2. Transition from hillslopes to river channels i) Drainage basins and river networks ii) Long valley profile and downstream fining iii) River channel morphology 3. River processes i) Flow in rivers ii) Sediment transport in rivers iii) Bedrock incision by rivers Bedrock Erosion Processes Plucking Abrasion Whipple, DiBiase and Crosby, 2013 41 Lecture 8 & 9: Intro to Geomorphology Erodibility Resistance to Erosion: There is at least a 5 order of magnitude range in bedrock erodiblity Erosion varies inversely as the square of the rock strength. 42 Lecture 8 & 9: Intro to Geomorphology Tools and Cover effect Bierman and Montgomery, 2014 Tumbler experiments Sklar and Dietrich (2001) Bierman and Montgomery, 2014 43 Lecture 8 & 9: Intro to Geomorphology Tools and Cover effect Bierman and Montgomery, 2014 ∆ ∂z =U-E∂t · qs All landscapes must obey this fundamental statement about sediment transport! Geomorphic transport laws In order to make predictions of landscape change Geomorphologists need to parameterize (E and qs): E includes: • Sediment production by weathering (P) • Bedrock erosion by glaciers, wind, water (W) qs includes erosion and deposition by: • Mass wasting transport processes • Fluvial transport processes The whole landscape in one equation! Photo courtesy of Bill Dietrich 44
