Choosing Class Jeremy 1
advertisement
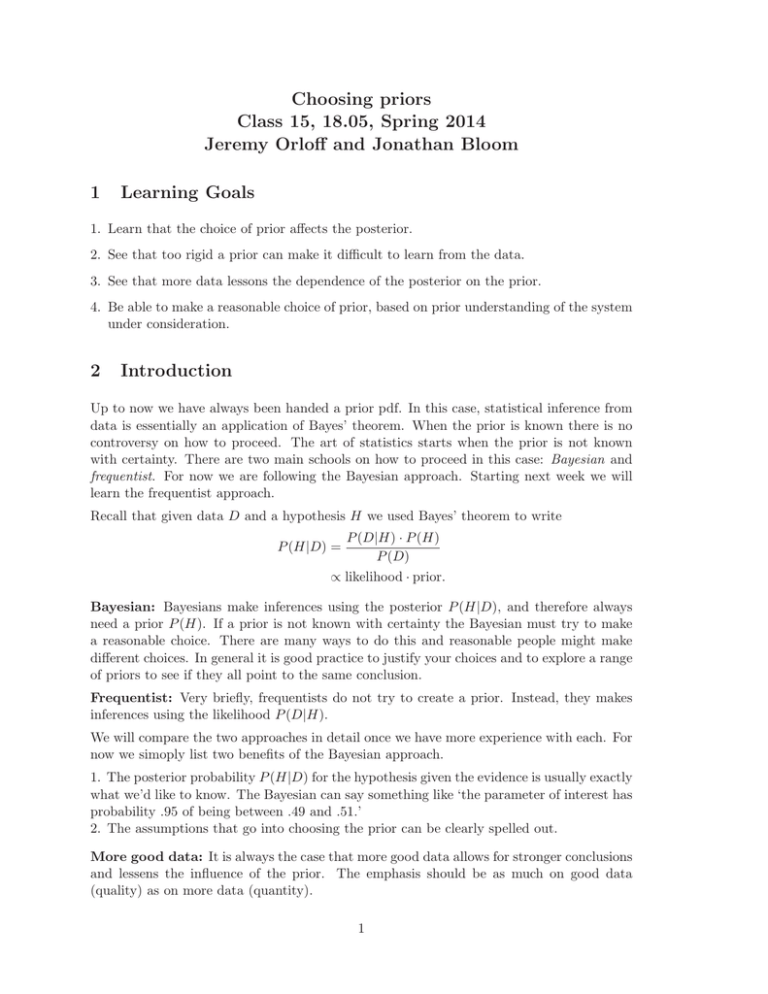
Choosing priors Class 15, 18.05, Spring 2014 Jeremy Orloff and Jonathan Bloom 1 Learning Goals 1. Learn that the choice of prior affects the posterior. 2. See that too rigid a prior can make it difficult to learn from the data. 3. See that more data lessons the dependence of the posterior on the prior. 4. Be able to make a reasonable choice of prior, based on prior understanding of the system under consideration. 2 Introduction Up to now we have always been handed a prior pdf. In this case, statistical inference from data is essentially an application of Bayes’ theorem. When the prior is known there is no controversy on how to proceed. The art of statistics starts when the prior is not known with certainty. There are two main schools on how to proceed in this case: Bayesian and frequentist. For now we are following the Bayesian approach. Starting next week we will learn the frequentist approach. Recall that given data D and a hypothesis H we used Bayes’ theorem to write P (D|H) · P (H) P (D) ∝ likelihood · prior. P (H|D) = Bayesian: Bayesians make inferences using the posterior P (H|D), and therefore always need a prior P (H). If a prior is not known with certainty the Bayesian must try to make a reasonable choice. There are many ways to do this and reasonable people might make different choices. In general it is good practice to justify your choices and to explore a range of priors to see if they all point to the same conclusion. Frequentist: Very briefly, frequentists do not try to create a prior. Instead, they makes inferences using the likelihood P (D|H). We will compare the two approaches in detail once we have more experience with each. For now we simoply list two benefits of the Bayesian approach. 1. The posterior probability P (H|D) for the hypothesis given the evidence is usually exactly what we’d like to know. The Bayesian can say something like ‘the parameter of interest has probability .95 of being between .49 and .51.’ 2. The assumptions that go into choosing the prior can be clearly spelled out. More good data: It is always the case that more good data allows for stronger conclusions and lessens the influence of the prior. The emphasis should be as much on good data (quality) as on more data (quantity). 1 18.05 class 15, Choosing priors, Spring 2014 3 2 Example: Dice Suppose we have a drawer full of dice, each of which has either 4, 6, 8, 12, or 20 sides. This time, we do not know how many of each type are in the drawer. A die is picked at random from the drawer and rolled 5 times. The results in order are 4, 2, 4, 7, and 5. 3.1 Uniform prior Suppose we have no idea what the distribution of dice in the drawer might be. In this case it’s reasonable to use a flat prior. Here is the update table for the posterior probabilities that result from updating after each roll. In order to fit all the columns, we leave out the unnormalized posteriors. hyp. H4 H6 H8 H12 H20 prior 1/5 1/5 1/5 1/5 1/5 lik1 1/4 1/6 1/8 1/12 1/20 post1 0.370 0.247 0.185 0.123 0.074 lik2 1/4 1/6 1/8 1/12 1/20 post2 0.542 0.241 0.135 0.060 0.022 lik3 1/4 1/6 1/8 1/12 1/20 post3 0.682 0.202 0.085 0.025 0.005 lik4 0 0 1/8 1/12 1/20 post4 0.000 0.000 0.818 0.161 0.021 lik5 0 1/6 1/8 1/12 1/20 post5 0.000 0.000 0.876 0.115 0.009 This should look familiar. Given the data the final posterior is heavily weighted towards hypthesis H8 that the 8-sided die was picked. 3.2 Other priors To see how much the above posterior depended on our choice of prior, let’s try some other priors. Suppose we have reason to believe that there are ten times as many 20-sided dice in the drawer as there are each of the other types. The table becomes: hyp. H4 H6 H8 H12 H20 prior 0.071 0.071 0.071 0.071 0.714 lik1 1/4 1/6 1/8 1/12 1/20 post1 0.222 0.148 0.111 0.074 0.444 lik2 1/4 1/6 1/8 1/12 1/20 post2 0.453 0.202 0.113 0.050 0.181 lik3 1/4 1/6 1/8 1/12 1/20 post3 0.650 0.193 0.081 0.024 0.052 lik4 0 0 1/8 1/12 1/20 post4 0.000 0.000 0.688 0.136 0.176 lik5 0 1/6 1/8 1/12 1/20 post5 0.000 0.000 0.810 0.107 0.083 lik5 0 1/6 1/8 1/12 1/20 post5 0.000 0.000 0.464 0.061 0.475 Even here the final posterior is heavily weighted to the hypothesis H8 . What if the 20-sided die is 100 times more likely than each of the others? hyp. H4 H6 H8 H12 H20 prior 0.010 0.010 0.010 0.010 0.962 lik1 1/4 1/6 1/8 1/12 1/20 post1 0.044 0.030 0.022 0.015 0.889 lik2 1/4 1/6 1/8 1/12 1/20 post2 0.172 0.077 0.043 0.019 0.689 lik3 1/4 1/6 1/8 1/12 1/20 post3 0.443 0.131 0.055 0.016 0.354 lik4 0 0 1/8 1/12 1/20 post4 0.000 0.000 0.266 0.053 0.681 With such a strong prior belief in the 20-sided die, the final posterior gives a lot of weight to the theory that the data arose from a 20-sided die, even though it extremely unlikely the 18.05 class 15, Choosing priors, Spring 2014 3 20-sided die would produce a maximum of 7 in 5 roles. The posterior now gives roughly even odds that an 8-sided die versus a 20-sided die was picked. 3.3 Rigid priors Mild cognitive dissonance. Too rigid a prior belief can overwhelm any amount of data. Suppose I’ve got it in my head that the die has to be 20-sided. So I set my prior to P (H20 ) = 1 with the other 4 hypotheses having probability 0. Look what happens in the update table. hyp. H4 H6 H8 H12 H20 prior 0 0 0 0 1 lik1 1/4 1/6 1/8 1/12 1/20 post1 0 0 0 0 1 lik2 1/4 1/6 1/8 1/12 1/20 post2 0 0 0 0 1 lik3 1/4 1/6 1/8 1/12 1/20 post3 0 0 0 0 1 lik4 0 0 1/8 1/12 1/20 post4 0 0 0 0 1 lik5 0 1/6 1/8 1/12 1/20 post5 0 0 0 0 1 No matter what the data, a hypothesis with prior probability 0 will have posterior probabil­ ity 0. In this case I’ll never get away from the hypothesis H20 , although I might experience some mild cognitive dissonance. Severe cognitive dissonance. Rigid priors can also lead to absurdities. Suppose I now have it in my head that the die must be 4-sided. So I set P (H4 ) = 1 and the other prior probabilities to 0. With the given data on the fourth roll I reach an impasse. A roll of 7 can’t possibly come from a 4-sided die. Yet this is the only hypothesis I’ll allow. My unnormalized posterior is a column of all zeros which cannot be normalized. hyp. H4 H6 H8 H12 H20 prior 1 0 0 0 0 lik1 1/4 1/6 1/8 1/12 1/20 post1 1 0 0 0 0 lik2 1/4 1/6 1/8 1/12 1/20 post2 1 0 0 0 0 lik3 1/4 1/6 1/8 1/12 1/20 post3 1 0 0 0 0 lik4 0 0 1/8 1/12 1/20 unnorm. post4 0 0 0 0 0 post4 ??? ??? ??? ??? ??? I must adjust my belief about what is possible or, more likely, I’ll suspect you of accidently or deliberately messing up the data. 4 Example: Malaria Here is a real example adapted from Statistics, A Bayesian Perspective by Donald Berry: By the 1950’s scientists had begun to formulate the hypothesis that carriers of the sickle-cell gene were more resistant to malaria than noncarriers. There was a fair amount of circum­ stantial evidence for this hypothesis. It also helped explain the persistance of an otherwise deleterious gene in the population. In one experiment scientists injected 30 African volun­ teers with malaria. Fifteen of the volunteers carried one copy of the sickle-cell gene and the other 15 were noncarriers. Fourteen out of 15 noncarriers developed malaria while only 2 18.05 class 15, Choosing priors, Spring 2014 4 out of 15 carriers did. Does this small sample support the hypothesis that the sickle-cell gene protects against malaria? Let S represent a carrier of the sickle-cell gene and N represent a non-carrier. Let D+ indicate developing malaria and D− indicate not developing malaria. The data can be put in a table. D+ D− S 2 13 15 N 14 1 15 16 14 30 Before analysing the data we should say a few words about the experiment and experimental design. First, it is clearly unethical: to gain some information they infected 16 people with malaria. We also need to worry about bias. How did they choose the test subjects. Is it possible the noncarriers were weaker and thus more susceptible to malaria than the carriers? Berry points out that it is reasonable to assume that an injection is similar to a mosquito bite, but it is not guaranteed. This last point means that if the experiment shows a relation between sickle-cell and protection against injected malaria, we need to consider the hypothesis that the protection from mosquito transmitted malaria is weaker or non-existant. Finally, we will frame our hypothesis as ’sickle-cell protects against malaria’, but really all we can hope to say from a study like this is that ’sickle-cell is correlated with protection against malaria’. Model. For our model let θS be the probability that an injected carrier S develops malaria and likewise let θN be the probabilitiy that an injected noncarrier N develops malaria. We assume independence between all the experimental subjects. With this model, the likelihood is a function of both θS and θN : 14 (1 − θN ). P (data|θS , θN ) = c θS2 (1 − θS )13 θN As usual weC leave )C15)the constant factor c as a letter. (It is a product of two binomial coefficients: c = 15 2 14 .) Hypotheses. Each hypothesis consists of a pair (θN , θS ). To keep things simple we will only consider a finite number of values for these probabilities. We could easily consider many more values or even a continuous range of hypotheses. Assume θS and θN are each one of 0, .2, .4, .6, .8, 1. This leads to two-dimensional tables. First is a table of hypotheses. The color coding indicates the following: 1. Light orange squares along the diagonal are where θS = θN , i.e. sickle-cell makes no difference one way or the other. 2. Pink and red squares above the above the diagonal are where θN > θS , i.e. sickle-cell provides some protection against malaria. 3. In the red squares θN − θS ≥ .6, i.e. sickle-cell provides a lot of protection. 4. White squares below diagonal are where θS > θN , i.e. sickle-cell actually increases the probability of developing malaria. 18.05 class 15, Choosing priors, Spring 2014 θN \θS 0 .2 5 .4 .6 .8 1 1 (0,1) (.2,1) (.4,1) (.6,1) (.8,1) (1,1) .8 (0,.8) (.2,.8) (.4,.8) (.6,.8) (.8,.8) (1,.8) .6 (0,.6) (.2,.6) (.4,.6) (.6,.6) (.8,.6) (1,.6) .4 (0,.4) (.2,.4) (.4,.4) (.6,.4) (.8,.4) (1,.4) .2 (0,.2) (.2,.2) (.4,.2) (.6,.2) (.8,.2) (1,.2) 0 (0,0) (.2,0) (.4,0) (.6,0) (.8,0) (1,0) Hypotheses on level of protection due to S: red = strong; pink = some; orange = none; white = negative. Next is the table of likelihoods. (Actually we’ve taken advantage of our indifference to scale and scaled all the likelihoods by 100000/c to make the table more presentable.) Notice that, to the precision of the table, many of the likelihoods are 0. The color coding is the same as in the hypothesis table. We’ve highlighted the biggest likelihoods with a blue border. θN \θS 1 .8 .6 .4 .2 0 0 0.00000 0.00000 0.00000 0.00000 0.00000 0.00000 .2 0.00000 1.93428 0.06893 0.00035 0.00000 0.00000 .4 0.00000 0.18381 0.00655 0.00003 0.00000 0.00000 .6 0.00000 0.00213 0.00008 0.00000 0.00000 0.00000 .8 0.00000 0.00000 0.00000 0.00000 0.00000 0.00000 1 0.00000 0.00000 0.00000 0.00000 0.00000 0.00000 Likelihoods scaled by 100000/c 4.1 Flat prior Suppose we have no opinion whatsoever on whether and to what degree sickle-cell protects against malaria. In this case it is reasonable to use a flat prior. Since there are 36 hypotheses each one gets a prior probability of 1/36. This is given in the table below. Remember each square in the table represents one hypothesis. Because it is a probability table we include the marginal pmf. θN \θS 0 .2 .4 .6 .8 1 p(θN ) 1 1/36 1/36 1/36 1/36 1/36 1/36 1/6 .8 1/36 1/36 1/36 1/36 1/36 1/36 1/6 .6 1/36 1/36 1/36 1/36 1/36 1/36 1/6 .4 1/36 1/36 1/36 1/36 1/36 1/36 1/6 .2 1/36 1/36 1/36 1/36 1/36 1/36 1/6 0 1/36 1/36 1/36 1/36 1/36 1/36 1/6 p(θS ) 1/6 1/6 1/6 1/6 1/6 1/6 1 Flat prior: every hypothesis (square) has equal probability To compute the posterior we simply multiply the likelihood table by the prior table and 18.05 class 15, Choosing priors, Spring 2014 6 normalize. Normalization means making sure the entire table sums to 1. θN \θS 1 .8 .6 .4 .2 0 0 0.00000 0.00000 0.00000 0.00000 0.00000 0.00000 .2 0.00000 0.88075 0.03139 0.00016 0.00000 0.00000 .4 0.00000 0.08370 0.00298 0.00002 0.00000 0.00000 .6 0.00000 0.00097 0.00003 0.00000 0.00000 0.00000 .8 0.00000 0.00000 0.00000 0.00000 0.00000 0.00000 1 p(θN |data) 0.00000 0.00000 0.00000 0.96542 0.00000 0.03440 0.00000 0.00018 0.00000 0.00000 0.00000 0.00000 p(θS |data) 0.00000 0.91230 0.08670 0.00100 0.00000 0.00000 1.00000 Posterior to flat prior To decide whether S confers protection against malaria, we compute the posterior proba­ bilities of ‘some protection’ and of ‘strong protection’. These are computed by summing the corresponding squares in the posterior table. Some protection: P (θN > θS ) = sum of pink and red = .99995 Strong protection: P (θN − θS > .6) = sum of red = .88075 Working from the flat prior, it is effectively certain that sickle-cell provides some protection and very probable that it provides strong protection. 4.2 Informed prior The experiment was not run without prior information. There was a lot of circumstantial evidence that the sickle-cell gene offered some protection against malaria. For example it was reported that a greater percentage of carriers survived to adulthood. Here’s one way to build an informed prior. We’ll reserve a reasonable amount of probability for the hypotheses that S gives no protection. Let’s say 24% split evenly among the 6 (orange) cells where θN = θS . We know we shouldn’t set any prior probabilities to 0, so let’s spread 6% of the probability evenly among the 15 white cells below the diagonal. That leaves 70% of the probability for the 15 pink and red squares above the diagonal. θN \θS 1 .8 .6 .4 .2 0 0 0.04667 0.04667 0.04667 0.04667 0.04667 0.04000 .2 0.04667 0.04667 0.04667 0.04667 0.04000 0.00400 .4 0.04667 0.04667 0.04667 0.04000 0.00400 0.00400 .6 0.04667 0.04667 0.04000 0.00400 0.00400 0.00400 .8 0.04667 0.04000 0.00400 0.00400 0.00400 0.00400 1 0.04000 0.00400 0.00400 0.00400 0.00400 0.00400 p(θS ) 0.27333 0.23067 0.18800 0.14533 0.10267 0.06000 p(θN ) 0.27333 0.23067 0.18800 0.14533 0.10267 0.06000 1.0 Informed prior: makes use of prior information that sickle-cell is protective. We then compute the posterior pmf. 18.05 class 15, Choosing priors, Spring 2014 θN \θS 1 .8 .6 .4 .2 0 0 0.00000 0.00000 0.00000 0.00000 0.00000 0.00000 .2 0.00000 0.88076 0.03139 0.00016 0.00000 0.00000 .4 0.00000 0.08370 0.00298 0.00001 0.00000 0.00000 7 .6 0.00000 0.00097 0.00003 0.00000 0.00000 0.00000 .8 0.00000 0.00000 0.00000 0.00000 0.00000 0.00000 1 p(θN |data) 0.00000 0.00000 0.00000 0.96543 0.00000 0.03440 0.00000 0.00017 0.00000 0.00000 0.00000 0.00000 p(θS |data) 0.00000 0.91231 0.08669 0.00100 0.00000 0.00000 1.00000 Posterior to informed prior. We again compute the posterior probabilities of ‘some protection’ and ‘strong protection’. Some protection: P (θN > θS ) = sum of pink and red = .99996 Strong protection: P (θN − θS > .6) = sum of red = .88076 Note that the informed posterior is nearly identical to the flat posterior. 4.3 PDALX Prob. diff. at least x The following plot is based on the flat prior. For each x, it gives the probability that θN − θS ≥ x. To make it smooth we used many more hypotheses. 1 0.8 0.6 0.4 0.2 0 0 0.2 0.4 0.6 0.8 x Probability the difference θN − θS is at least x (PDALX). Notice that it is virtually certain that the difference is at least .4. 1 MIT OpenCourseWare http://ocw.mit.edu 18.05 Introduction to Probability and Statistics Spring 2014 For information about citing these materials or our Terms of Use, visit: http://ocw.mit.edu/terms.

