LIST OF FIGURES Figure 1.1 from Magoon, 1994). ............................................................................ 4
advertisement
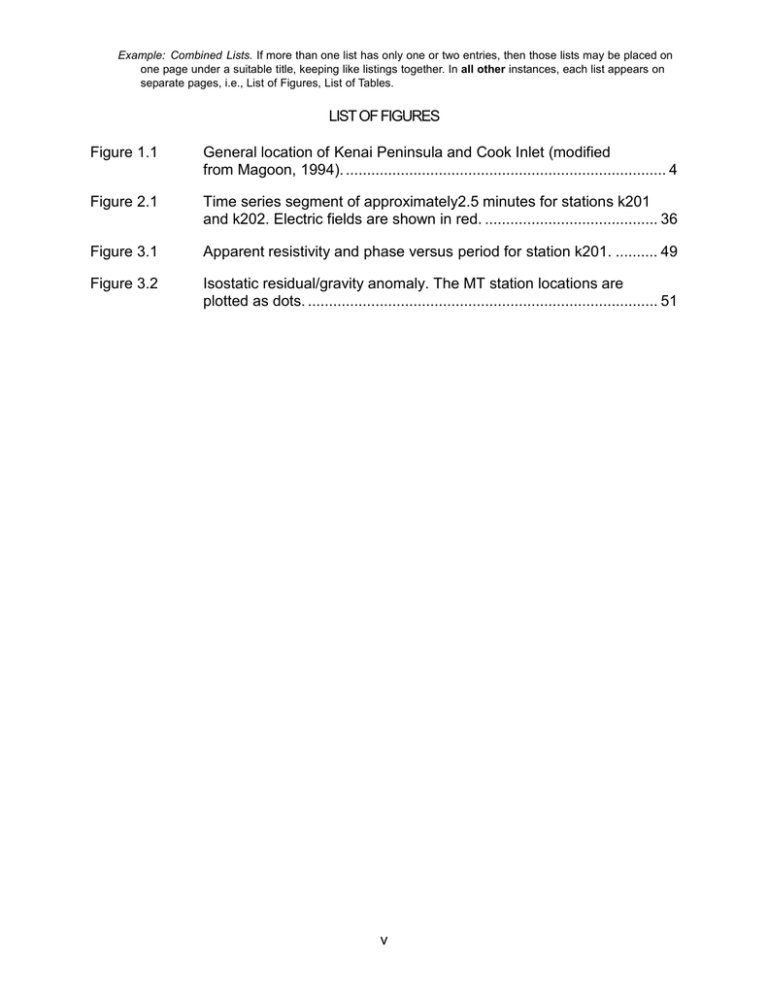
Example: Combined Lists. If more than one list has only one or two entries, then those lists may be placed on one page under a suitable title, keeping like listings together. In all other instances, each list appears on separate pages, i.e., List of Figures, List of Tables. LIST OF FIGURES Figure 1.1 General location of Kenai Peninsula and Cook Inlet (modified from Magoon, 1994). ............................................................................ 4 Figure 2.1 Time series segment of approximately2.5 minutes for stations k201 and k202. Electric fields are shown in red. ......................................... 36 Figure 3.1 Apparent resistivity and phase versus period for station k201. .......... 49 Figure 3.2 Isostatic residual/gravity anomaly. The MT station locations are plotted as dots. ................................................................................... 51 v
![VLOOKUP ([Score], A5:B10, 2)](http://s3.studylib.net/store/data/007008406_1-329b439ee1a3b5923ce08e77bb280c5d-300x300.png)

