NEWS ADVISORY
advertisement
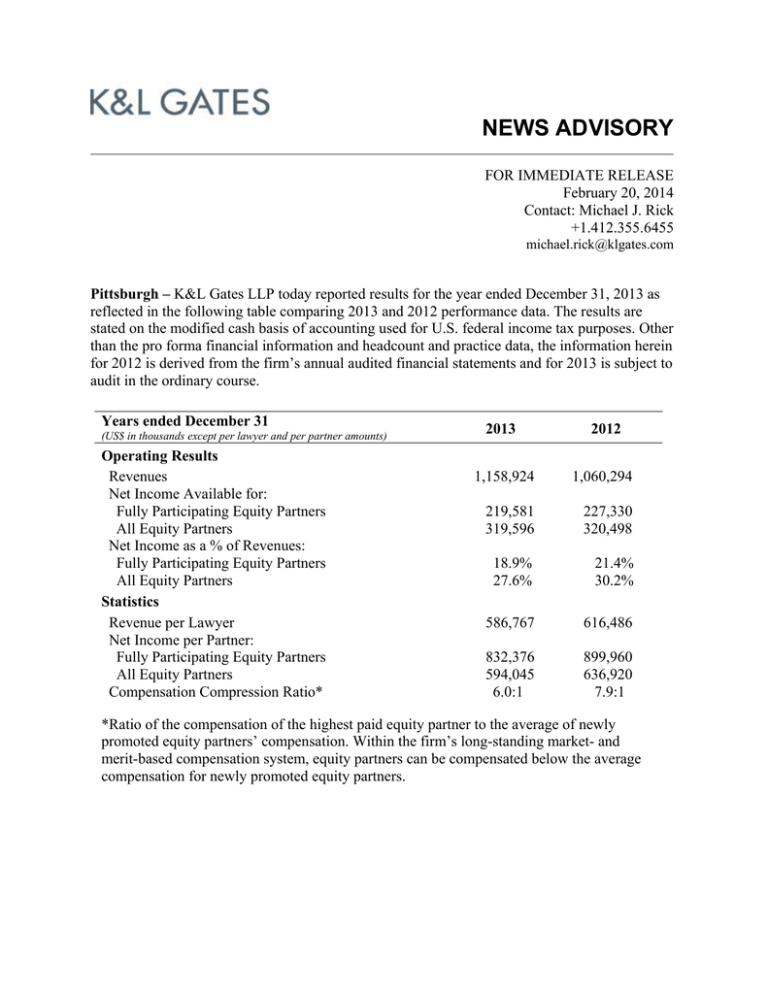
f NEWS ADVISORY FOR IMMEDIATE RELEASE February 20, 2014 Contact: Michael J. Rick +1.412.355.6455 michael.rick@klgates.com Pittsburgh – K&L Gates LLP today reported results for the year ended December 31, 2013 as reflected in the following table comparing 2013 and 2012 performance data. The results are stated on the modified cash basis of accounting used for U.S. federal income tax purposes. Other than the pro forma financial information and headcount and practice data, the information herein for 2012 is derived from the firm’s annual audited financial statements and for 2013 is subject to audit in the ordinary course. Years ended December 31 (US$ in thousands except per lawyer and per partner amounts) Operating Results Revenues Net Income Available for: Fully Participating Equity Partners All Equity Partners Net Income as a % of Revenues: Fully Participating Equity Partners All Equity Partners Statistics Revenue per Lawyer Net Income per Partner: Fully Participating Equity Partners All Equity Partners Compensation Compression Ratio* 2013 2012 1,158,924 1,060,294 219,581 319,596 227,330 320,498 18.9% 27.6% 21.4% 30.2% 586,767 616,486 832,376 594,045 6.0:1 899,960 636,920 7.9:1 *Ratio of the compensation of the highest paid equity partner to the average of newly promoted equity partners’ compensation. Within the firm’s long-standing market- and merit-based compensation system, equity partners can be compensated below the average compensation for newly promoted equity partners. At December 31 (US$ in thousands) Cash and Cash Equivalents Age of Unbilled Fees (days) Age of Accounts Receivable (days) Investments in Leasehold Improvements, Information Technology, Furnishings and Office Equipment (net of accumulated depreciation) Bank Debt – Year End Low for Year High for Year Partner Capital: Required Discretionary Balances Subject to Withdrawal Annual Retirement Obligation Expense as a % of Revenues** 2013 210,661 36.9 33.2 2012 220,722 37.9 33.0 109,248 -0-0-0- 109,629 -0-0-0- 171,272 188,917 173,784 187,883 0.3% 0.3% **Reflects payments under frozen legacy retirement programs Performance for 2013 continued to reflect a challenged legal marketplace and, as compared to 2012, was predominantly driven by the financial impact of the combination on January 1, 2013 with the Australian national firm, Middletons. Revenues increased by 9.3% in 2013 as a result of the Middletons combination and new offices in Houston, Texas; Seoul, South Korea and Wilmington, Delaware, offset to a degree by a net decrease in revenues elsewhere in the firm resulting from reductions in productivity and collection performance. Revenue for 2013 was also negatively impacted by unfavorable U.S. Dollar exchange rates related to the Australian Dollar. On a pro forma combined basis with Middletons as if the combination had occurred on January 1, 2012, firmwide revenue would have declined 1.9% in 2013, of which 0.8% was due to the unfavorable Australian Dollar exchange rate. Revenue per lawyer decreased 4.8% in 2013 as compared to 2012 (1.6% on a pro forma combined basis) due primarily to the dilutive impact on this metric of the headcount additions in the combination with Middletons and reduced revenue in Asia, partially offset by an improvement in Europe and the Middle East. On a pro forma combined basis, the Energy, Infrastructure and Resources; Litigation and Disputes Resolution; and Real Estate practice areas turned in measurably stronger performances in a year over year comparison, with the remaining practice areas within slight bands, up or down, as against the prior year’s performance. Soft demand had a continuing negative impact on the Corporate and Transactional practice area. The percentage of the firm’s work attributable to matters generated in one office and performed in one or more other firm offices increased marginally from 27.5% in 2012 to 27.7% in 2013, continuing a more than decade long trend of increasing levels of interoffice work. At the same time, the dollar amount of such work increased materially, reflecting significant progress in the ramp up of synergies with the firm’s Australian and other new offices. In 2013, 466 of the firm’s 500 largest clients used lawyers from two or more firm offices, and 15 of the firm’s 20 largest -2- clients used lawyers from 10 or more firm offices. The average number of offices engaged on projects by the firm’s 20 largest clients in 2013 was 16.2. For the firm’s 100 largest clients in 2013, which generated 31.7% of 2013 revenues, the average number of offices engaged was 10.9. Net income available for all equity partners as a percentage of revenues was 27.6% in 2013 as compared to 30.2% (29.7% on a pro forma combined basis) in 2012. The year on year decline was principally due to the decreased revenue experienced by the combined firm on a pro forma basis. The profit percentage continued to be influenced by the firm’s commitment to meet market demand with large numbers of income partners, whose compensation is accounted for as expense. If income partners’ compensation were paid out of net income rather than expensed, the profit percentage for 2013 would have been 38.6% as compared with 41.8% in 2012. Revenues by region for 2013 and 2012 were as follows: Years Ended December 31 2013 2012 901,648 147,772 109,504 1,158,924 924,935 41,486 93,873 1,060,294 (US$ in thousands) Americas Asia Pacific Europe/Middle East Total Firmwide revenues in 2013 increased 9.3% as compared to 2012. In the Americas, revenues decreased by 2.5% on decreased average headcount of 3.5%. Revenues increased materially in the Asia Pacific region due to the Middletons combination, offset by a net decrease of 22.7% in the rest of the region on a net productivity decrease, unfavorable U.S. Dollar exchange rates related to the Japanese Yen and a modest headcount decline. Revenues increased by 16.7% in the Europe/Middle East region due to productivity increases and increased average headcount of 6.2%. The changes in revenues, net income and metrics expressed as averages include the effect of movements in average foreign currency exchange rates relative to the U.S. Dollar. During 2013 the U.S. Dollar appreciated by 6.8% relative to the Australian Dollar, by 1.3% relative to the GBP Sterling and by 18.2% relative to the Japanese Yen, which had the effect of reducing revenues and other metrics when stated in U.S. Dollars. Also during 2013 the U.S. Dollar declined relative to the Euro by 3.3%, offsetting somewhat the reduction in revenues and other metrics stated in U.S. Dollars for the other currencies mentioned. Other currency movements either are insignificant relative to the U.S. Dollar or are pegged to the U.S. Dollar. Indicia of financial stability remained strong in 2013, with significant cash balances and partner capital, no bank debt, the availability of $75 million under bank lines of credit, and negligible retirement expense as a percentage of revenues. No client accounted for more than 5% of firm revenues in 2013 or 2012. Components of the firm’s balance sheet as of December 31, 2013 remained generally flat compared with the prior year end. -3- K&L Gates continued to execute on its long-term growth strategy in 2013 by opening U.S. offices in Wilmington, Delaware and Houston, Texas; by commencing operations in its Seoul office announced in 2012; and by consummating its combination with Middletons. The firm also plans by September 2014 to consolidate its four-lawyer San Diego office with the firm’s growing Orange County office. The San Diego office was established in early 2008 by the Chicago-based firm Bell, Boyd & Lloyd LLP, which combined with K&L Gates in March 2009. All financial and other data presented herein other than when stated as being on a pro forma combined basis are exclusive of Middletons for 2012 and inclusive of Middletons for 2013. Headcount for 2013 and 2012 was as follows: Years Ended December 31 Fully Participating Equity Partners: At Year End Average All Equity Partners At Year End Average Lawyers: At Year End Average Other Legal Professionals: At Year End Average Total Average Legal Professionals 2013 2012 272.0 263.8 258.0 252.6 540.0 538.0 502.0 503.2 2,093.0 1,975.1 1,748.0 1,719.9 383.0 306.6 2,281.7 333.0 293.2 2,013.1 Headcount increased in 2013 as compared to 2012 as the result of the Middletons combination, the establishment of the Houston, Wilmington and Seoul offices, and additions of legal personnel to other offices of the firm, offset to a modest degree by attrition. K&L Gates practices out of 48 fully integrated offices located in the United States, Asia, Australia, Europe, the Middle East and South America and represents leading global corporations, growth and middle-market companies, capital markets participants and entrepreneurs in every major industry group as well as public sector entities, educational institutions, philanthropic organizations and individuals. For more information about K&L Gates or its locations, practices and registrations, visit www.klgates.com. K&L Gates has offices in: Anchorage, Austin, Beijing, Berlin, Boston, Brisbane, Brussels, Charleston, Charlotte, Chicago, Dallas, Doha, Dubai, Fort Worth, Frankfurt, Harrisburg, Hong Kong, Houston, London, Los Angeles, Melbourne, Miami, Milan, Moscow, Newark, New York, Orange County, Palo Alto, Paris, Perth, Pittsburgh, Portland, Raleigh, Research Triangle Park, San Diego, San Francisco, São Paulo, Seattle, Seoul, Shanghai, Singapore, Spokane, Sydney, Taipei, Tokyo, Warsaw, Washington, D.C., and Wilmington. # # # -4-
