1. Nature of Measurement Errors*
advertisement
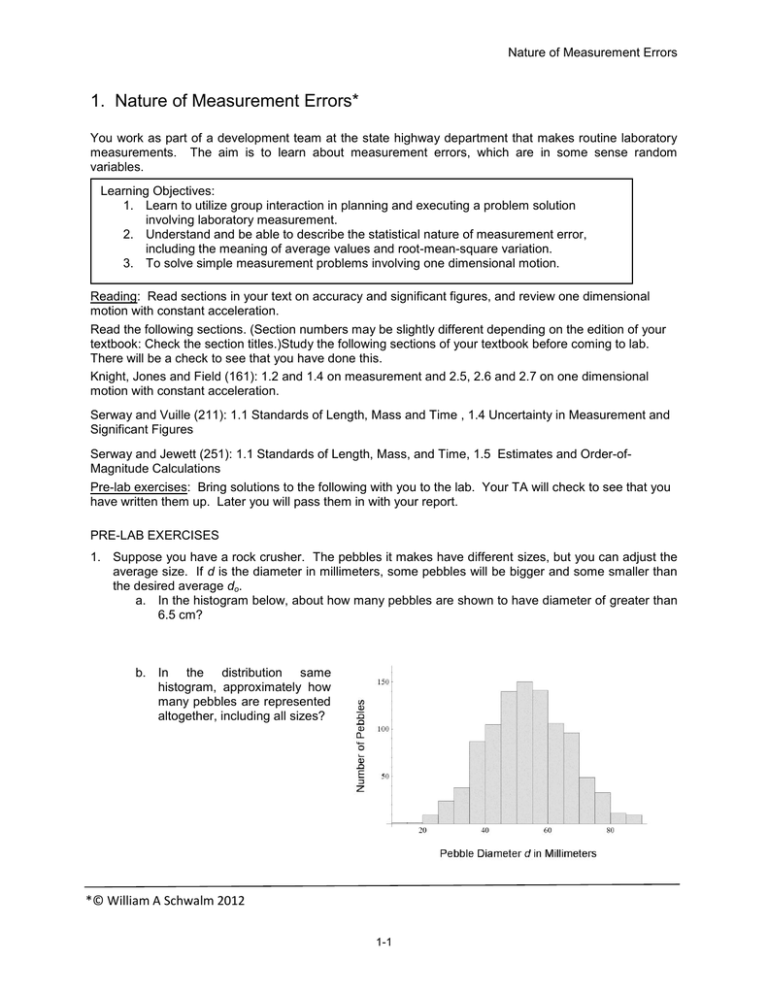
Nature of Measurement Errors 1. Nature of Measurement Errors* You work as part of a development team at the state highway department that makes routine laboratory measurements. The aim is to learn about measurement errors, which are in some sense random variables. Learning Objectives: 1. Learn to utilize group interaction in planning and executing a problem solution involving laboratory measurement. 2. Understand and be able to describe the statistical nature of measurement error, including the meaning of average values and root-mean-square variation. 3. To solve simple measurement problems involving one dimensional motion. Reading: Read sections in your text on accuracy and significant figures, and review one dimensional motion with constant acceleration. Read the following sections. (Section numbers may be slightly different depending on the edition of your textbook: Check the section titles.)Study the following sections of your textbook before coming to lab. There will be a check to see that you have done this. Knight, Jones and Field (161): 1.2 and 1.4 on measurement and 2.5, 2.6 and 2.7 on one dimensional motion with constant acceleration. Serway and Vuille (211): 1.1 Standards of Length, Mass and Time , 1.4 Uncertainty in Measurement and Significant Figures Serway and Jewett (251): 1.1 Standards of Length, Mass, and Time, 1.5 Estimates and Order-ofMagnitude Calculations Pre-lab exercises: Bring solutions to the following with you to the lab. Your TA will check to see that you have written them up. Later you will pass them in with your report. PRE-LAB EXERCISES 1. Suppose you have a rock crusher. The pebbles it makes have different sizes, but you can adjust the average size. If d is the diameter in millimeters, some pebbles will be bigger and some smaller than the desired average do. a. In the histogram below, about how many pebbles are shown to have diameter of greater than 6.5 cm? b. In the distribution same histogram, approximately how many pebbles are represented altogether, including all sizes? *© William A Schwalm 2012 1-1 Nature of Measurement Errors b. (cont.) c. Suppose you made a batch of 7 10 pebbles crushed by the same rock crusher, using the same settings and the same raw material. Estimate how many pebbles would have diameter of greater than 6.5 mm. (Remember to explain your reasoning in sentences.) 7 d. Let do represent the average pebble diameter. About half of the pebbles will have diameters less than do and about half will have greater diameter, but this is not always precisely true. For example, consider the set of numbers 1,2,3,4,5,15 . Calculate the mean or average value and show that this value does not fall in the middle of the distribution. About where would the “middle” be? Nevertheless it is often reasonable to suppose the mean value is above approximately at the center of the set of values. e. Let’s consider variability in pebble size. We’ll work on the idea of root-mean-square (rms) variability. How much spread is there around the mean value? You can’t just average the difference d – do for each data point, because that average is always zero. So what you do first is square the differences, then average the squares (all positive numbers) and then take the square root. This root of the mean of the squares of the differences from do is called the root-mean-square (rms) variability . It turns out that when the distribution looks sort of bellshaped about 68% of the data fall between do and do , Also about 95% of the data fall between do 2 and do 2 . For the following (short!) list of pebble sizes, find the mean value and the rms variability. (Sizes d in mm) 1 2 3 4 5 6 f. 5.846 10.057 4.98 7.104 7.856 9.392 7 8 9 10 11 12 5.927 12.301 10.159 9.507 3.442 3.476 Compose two sentences to give the practical meaning (more than a definition) of the mean value and the rms variance of some data. In other words, what does each of these two statistics actually tell you about the data? 2. The next problem also has to do with multiple measurements. It has to do with time measurements rather than diameter measurements, but the ideas are the same. From your reading, write down 1-2 Nature of Measurement Errors formulas for the distance traveled and for the velocity, each as a function of time, in terms of initial speed and the acceleration a, assuming the acceleration is constant. This situation applies to a falling object or a car skidding to a stop. 3. In an experiment at your lab, a driver driving along at 15 miles per hour (22 ft/sec) is given without warning a signal to apply the breaks. Tests show that the reaction time—that is the time from the signal to when the breaks lock—has a mean value of .68 seconds and an rms variance of .25 sec. If 2 the road conditions are such that the frictional acceleration with breaks locked comes out - 20 ft/sec , then a. How far down the road from where the signal is given will the typical (average) diver stop? b. Between about what two distances down the road will 68% of the drivers stop? c. If you needed to figure out a distance dmax down the road such that about 97.5% of a random sample of drivers in these conditions could stop before reaching the distance dmax, what would you estimate for dmax? Equipment: You should find a meter stick, stopwatch, and wooden blocks. Also in the room is a triple beam balance for determining mass. A calculator is available on your computer. (On the Start menu, go under Programs, Accessories, Calculator). Exploration: Try out the stopwatch in particular. The controls are confusing and also it takes some practice to get the watches to start and stop at the desired point. Everyone in the group has to practice this. The triple beam balance should be leveled, and also you will find a little screw used to be sure the apparatus will balance at zero when nothing is on the pan. 1-3 Nature of Measurement Errors Problem 1 Your supervisor at the Highway Department Research Station needs to know about the accuracy of time measurements your group can make with a stopwatch. The watch may produce numbers showing tenths or even hundredths of a second, but it is ridiculous to suppose that your measurements can be accurate to within such a small margin of error. Imagine an experiment where you start the watch and then, while staring at the watch face, you try to stop the watch at exactly the 10 second mark. Of course, your reactions are not good enough to do this within 1/100 of a second, at least all the time. What you are actually measuring is how well you can control the watch. Thus you will get a statistical distribution of errors from which you can estimate the variance. This is what limits the accuracy in a time measurement. 1. Prediction question: How large do you expect the variance in time measurements will be if you do this experiment? (a) Suppose from these data, we make a rude histogram, using “Xs” as follows: 2. Method question: Suppose one of my group members tries this test twelve times, and gets these results: Trial # 1 2 3 4 5 6 7 8 9 10 11 12 time sec 9.29 10.2 9.34 9.48 10.26 9.98 9.85 10.13 10.32 10.29 10.2 9.86 time minus 10 sec 0.71 0.2 0.66 0.52 0.26 0.02 0.15 0.13 0.32 0.29 0.2 0.14 -.8 -.6 -.4 -.2 0 +.2 +.4 +.6 The average value of the error (-.07) is pretty close to zero, as it happens, but that’s probably an accident. Place a time interval centered at 0 such that 2 3 of the data fall into it. How large (in seconds) is this interval to the nearest tenth of a second? Now if I calculate (you do not need to check this) the rms variability from the data using a calculator, I get .36 seconds, about. How does this compare with the interval size you found in part (a)? How should it compare, based on the discussion above? Reading carefully, see if you can explain any discrepancy. 1-4 +.8 Nature of Measurement Errors What did you learn about the use of a histogram? Plan: Outline very briefly a plan for finding the limit to the accuracy of time measurements using a stopwatch. You have to figure out what data you need, how to take and record the data and how the data will be analyzed. Record your plan here in a few complete sentences. You will want to design a data table as part of your plan. Implementation: Go ahead and take your data. They should be recorded here, together with units and enough notations so that you can keep track of what data you have, etc. Analysis: Carry out the analysis portion of your plan. Explain as necessary what you are doing. One way to help make the explanation clear is to provide a sample calculation showing all the steps for a particular case. In any event, you must also write a sentence or two of explanation, where appropriate. 1-5 Nature of Measurement Errors Conclusions: What did you learn? 1. What can you say about the accuracy in making time measurements with a stop watch? What is the minimum variance you can expect? What causes this variation? 2. Can you think of a way to cut down the error? What would happen if you made each time measurement five times and averaged? Would this make for better accuracy, do you think? If so, by roughly how much? 1-6 Nature of Measurement Errors Problem 2 Measuring driver reaction time. One way is to have one group member hold a meter stick out so that it can drop through another group member’s hand, in such a way that you can measure how far the stick falls before the second person can grab it. The first person drops the stick without warning and the second grabs it as quickly as possible. Using a method based on this idea, measure an average reaction time for each group member. 1. Method question: If the stick falls a distance h before being caught, how much time does this correspond to? 2. Prediction question: A psychologist working for the department proposes the following theory: Driver reaction time must divide into two parts. In this experiment the parts would be (a) the time it takes to close the hand, even when you already know exactly when the stick is going to be released, and (b) the time it take to recognize that the stick has been released. Estimate the first part of the reaction time and explain where you got your estimate. (This question is open-ended, as things often are in real life, so just do the best you can.) Plan: Write an outline of a measurement plan for making reaction time measurements for the members of your group. You will use these to predict typical driver reaction times. Be aware that the Highway Department also needs an estimate of the accuracy of the prediction and how much variation to expect from driver to driver. 1-7 Nature of Measurement Errors Implementation: Go ahead and collect data, according to your plan, together with the units and enough ancillary information to ensure that you and everyone else will know hat the data mean. Analysis: Analyze the data as you have planned. Show enough of your work, and explain the analysis, so that another person not in your group (such as your TA) can understand what you have done. Conclusions: Draw meaningful conclusions about driver reaction times. 1. What would a typical reaction time be? What two processes does this consist of and how much time does each account for? 2. About how much variability should one expect in reaction times? Is the variability nearly as much as the average reaction time? How did you determine this? 1-8 Nature of Measurement Errors Problem 3 The Department also wants to know how well lengths (sizes of objects) and distances (between points) can be measured by a typical person using a meter stick. Of particular interest are distances in the order of 10 cm or so, a small fraction of a meter. You have a meter stick and a block of wood. One way to assess measurement variability would be for each group member independently to make the most careful measurement possible of the length, width and depth of the wooden block. Use this method to get the density of the wooden block, and also an estimate of the measurement errors involved. 1. Prediction question: Do you think that the error in measuring lengths, widths, etc. of a wooden block will turn out to be limited mostly by the smallest division on the meter stick, that is to say a millimeter? If not, why not? 2. Method question: How can you study the variability in measurement values for measurements of the same block dimension by the same person multiple times? How about measurements of the same dimension but by different people? Plan: Make up a simple plan for measuring length, width and depth of your wooden block by the members of your group. At the same time, you should figure out the statistics of measurement error. Each member should compute the volume of the block, including an error estimate, measure the mass and finally compute the density. Each member should thus arrive at a value for the density of wood, together with an error estimate. Record your plan here. 1-9 Nature of Measurement Errors Implementation: Put your plan into operation. Record your data here, with units, and enough information to see what the data mean, including multiple measurements where called for. Analysis: Analyze the data, according to your plan, including a thoughtful analysis of the measurement error involved, and a final value for the density of wood (something plus or minus something). Explain (as usual) where appropriate and give examples of each type of calculation. Conclusions: 1. What can you report to the Highway Department about the accuracy in making small distance measurements with a meter stick? You need to be quantitative here. Write in complete sentences. 2. What can you report about the density of wood and the limits to the accuracy in your value? How did you get the error estimates? Notice: From this point on, in each subsequent laboratory unit, you will always be expected to discuss the effect of measurement error. Using the ideas developed in this lab period, you will always need to estimate the measurement errors in each quantity your group has to find a value for. This just stands to reason. It’s the way the world really is. 1-10
