Current Research Journal of Social Sciences 7(3): 94-100, 2015
advertisement
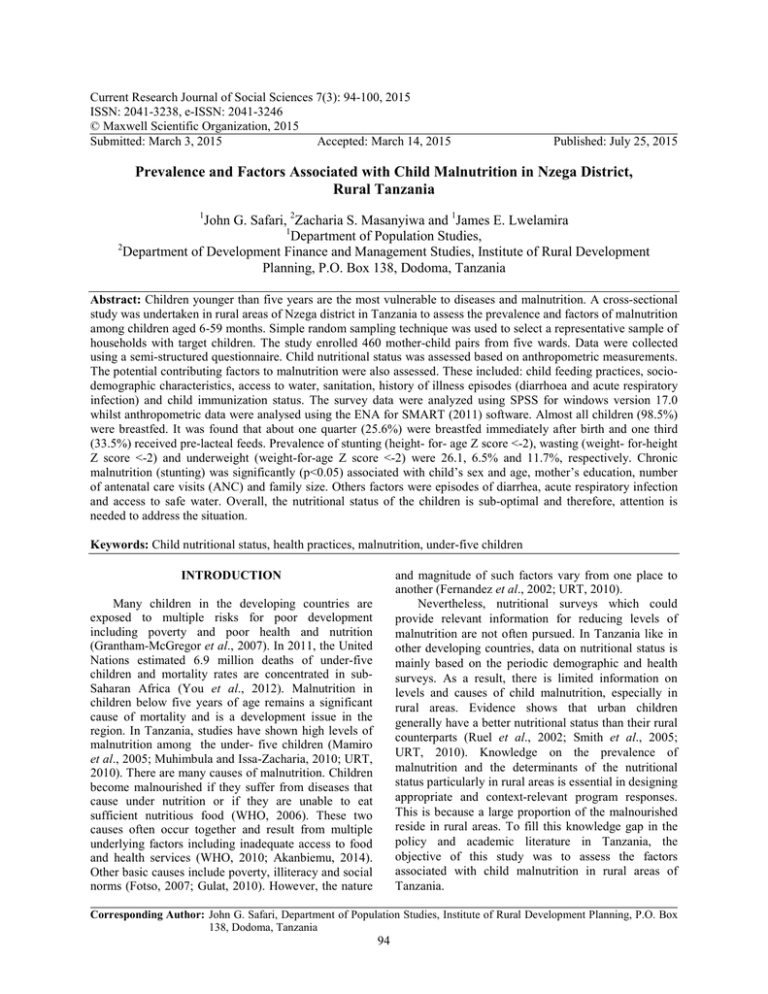
Current Research Journal of Social Sciences 7(3): 94-100, 2015 ISSN: 2041-3238, e-ISSN: 2041-3246 © Maxwell Scientific Organization, 2015 Submitted: March 3, 2015 Accepted: March 14, 2015 Published: July 25, 2015 Prevalence and Factors Associated with Child Malnutrition in Nzega District, Rural Tanzania 1 John G. Safari, 2Zacharia S. Masanyiwa and 1James E. Lwelamira 1 Department of Population Studies, 2 Department of Development Finance and Management Studies, Institute of Rural Development Planning, P.O. Box 138, Dodoma, Tanzania Abstract: Children younger than five years are the most vulnerable to diseases and malnutrition. A cross-sectional study was undertaken in rural areas of Nzega district in Tanzania to assess the prevalence and factors of malnutrition among children aged 6-59 months. Simple random sampling technique was used to select a representative sample of households with target children. The study enrolled 460 mother-child pairs from five wards. Data were collected using a semi-structured questionnaire. Child nutritional status was assessed based on anthropometric measurements. The potential contributing factors to malnutrition were also assessed. These included: child feeding practices, sociodemographic characteristics, access to water, sanitation, history of illness episodes (diarrhoea and acute respiratory infection) and child immunization status. The survey data were analyzed using SPSS for windows version 17.0 whilst anthropometric data were analysed using the ENA for SMART (2011) software. Almost all children (98.5%) were breastfed. It was found that about one quarter (25.6%) were breastfed immediately after birth and one third (33.5%) received pre-lacteal feeds. Prevalence of stunting (height- for- age Z score <-2), wasting (weight- for-height Z score <-2) and underweight (weight-for-age Z score <-2) were 26.1, 6.5% and 11.7%, respectively. Chronic malnutrition (stunting) was significantly (p<0.05) associated with child’s sex and age, mother’s education, number of antenatal care visits (ANC) and family size. Others factors were episodes of diarrhea, acute respiratory infection and access to safe water. Overall, the nutritional status of the children is sub-optimal and therefore, attention is needed to address the situation. Keywords: Child nutritional status, health practices, malnutrition, under-five children and magnitude of such factors vary from one place to another (Fernandez et al., 2002; URT, 2010). Nevertheless, nutritional surveys which could provide relevant information for reducing levels of malnutrition are not often pursued. In Tanzania like in other developing countries, data on nutritional status is mainly based on the periodic demographic and health surveys. As a result, there is limited information on levels and causes of child malnutrition, especially in rural areas. Evidence shows that urban children generally have a better nutritional status than their rural counterparts (Ruel et al., 2002; Smith et al., 2005; URT, 2010). Knowledge on the prevalence of malnutrition and the determinants of the nutritional status particularly in rural areas is essential in designing appropriate and context-relevant program responses. This is because a large proportion of the malnourished reside in rural areas. To fill this knowledge gap in the policy and academic literature in Tanzania, the objective of this study was to assess the factors associated with child malnutrition in rural areas of Tanzania. INTRODUCTION Many children in the developing countries are exposed to multiple risks for poor development including poverty and poor health and nutrition (Grantham-McGregor et al., 2007). In 2011, the United Nations estimated 6.9 million deaths of under-five children and mortality rates are concentrated in subSaharan Africa (You et al., 2012). Malnutrition in children below five years of age remains a significant cause of mortality and is a development issue in the region. In Tanzania, studies have shown high levels of malnutrition among the under- five children (Mamiro et al., 2005; Muhimbula and Issa-Zacharia, 2010; URT, 2010). There are many causes of malnutrition. Children become malnourished if they suffer from diseases that cause under nutrition or if they are unable to eat sufficient nutritious food (WHO, 2006). These two causes often occur together and result from multiple underlying factors including inadequate access to food and health services (WHO, 2010; Akanbiemu, 2014). Other basic causes include poverty, illiteracy and social norms (Fotso, 2007; Gulat, 2010). However, the nature Corresponding Author: John G. Safari, Department of Population Studies, Institute of Rural Development Planning, P.O. Box 138, Dodoma, Tanzania 94 Curr. Res. J. Soc. Sci., 7(3): 94-100, 2015 days after birth and the duration a child was breastfed. Immunization coverage was determined by assessing whether a child was fully immunized or not. The Ministry of Health recommends vaccines before 12 months which include immunization against tuberculosis (BCG), Diphtheria, Pertussis, Tetanus (DPT), measles and poliomyelitis. To be fully immunized, a child has to receive one dose of BCG, three doses each of DPT and polio vaccine and one dose of measles vaccine. Information on immunization status was obtained from the children’s clinic cards (or mothers’ recall for children whose cards could not be seen). MATERIALS AND METHODS Study area and design: This study was conducted in 2012 in Nzega District in Tanzania. The district is located at latitude 4099’S and longitude 33099’ E and about 1228 m above the mean sea level. It has a population of 502,252 people of whom 257,249 (51.2%) are females and 245,003 (48.8%) are males with an average of household size of 5.8 (URT, 2013). A two stage sampling technique was used to select a representative sample of 460 households. Data were collected from 14 villages in five wards namely Bukene, Mogwa, Kahamayang 'halanga, Uduka and Ikindwa. The research participants were sampled using a two-stage cluster design. At first stage of sampling, a total of two villages/clusters were selected from each ward based on probability proportional to the population size obtained from the district population village list of the 2012 national census (URT, 2013). At the second stage, an average of 46 households was sampled from each village selected in the first stage. A household was defined as a group of people living, cooking and eating together. The household was used as a sampling unit because it is an arena where much of daily life takes place and the centre of processes that determine the welfare of individual members, including child nutritional status (Niehof and Price, 2001). Anthropometric measurements: Children of both sexes aged 6-59 months, were measured for height (cm) and weight (kg) to assess their nutritional status. Weight was measured on an electronic SECA weighing scale (SECA Vogel and Halke, Haamburg, Germany). Height was measured with a portable Harpenden stadiometer (Holtain Ltd., London, UK) with a capacity of measuring up to 25 kg. Readings were made to the nearest 0.1cm. Adherence to the measuring techniques and recording procedures were observed to reduce measurement error. An assessment of bilateral oedema was done. The enumerator gently applied pressure on the feet of children for three seconds using the thumbs. Children showing the print of the thumbs after three seconds were considered to have oedema. Information on children feeding practices and health status was gathered using structured questionnaires. Child age was obtained from the birth certificates, clinic cards or mother’s recall. Where a household had two or more children in the target age group or twins, one child was selected randomly. The decision to enroll one child in a household is based on the fact that nutritional and health outcomes of siblings are likely to be related due to similarity in parental care, the sanitary conditions and availability and quality of food within the household. Sampling and sample size estimation: The sample size (n) was calculated by using the formula adopted from Fisher et al. (1991) as follows: n = Z2pq/d2. The following values were assumed: z = 1.96, a value for standard normal deviate at 95% confidence level; p = 0.16, prevalence of underweight in Tanzania based on weight-for-age Z score (URT, 2010). Weight-for-age is composite index of height-for-age and weight-forheight, q = 1-p and d = 0.05, the degree required for accuracy. The calculation resulted in a sample of 206 children. The calculated sample was multiplied by 2 to correct for the design effect. Ten percent (10%) of the total sample size was added as an attrition rate for any dropout of the study subjects during the study period. Therefore, a total of 460 mother-child pairs were sampled. During sampling, in case a household was found to have no child of the target age, such household was replaced by another nearby household chosen at random. Data processing and analysis: Statistical Package for Social Sciences (SPSS) version 17 was used to analyse data. Descriptive statistics such as frequencies, percentages and means were used to obtain the variability and central tendencies of variables. The weight and height measurements were converted into three summary indices of nutritional status: Weight-forheight (wasting) and weight-for-age (underweight) and height- for- age (stunting) according to WHO criterion based on Standard Deviation (SD) units (termed as Z scores). Thus, wasting was defined as weight-for-height Z score less than -2, underweight as weight for age Z score less than -2 and stunting as height-for-age Z score less than -2. The analysis was performed using ENA for SMART (2011) software. Chi-square test was used to assess associations between potential determinants of malnutrition and indicator of chronic malnutrition Data collection methods and instruments: Mothers of selected children who were willing to participate in this study were interviewed using a semi-structured questionnaire. Information collected included: child feeding practices, socio-demographic characteristics, antenatal visits (ANC), access to water, sanitation, history of illness episodes (diarrhoea and acute respiratory infection) and child immunization status. Assessment of child feeding practices included initiation, whether a child was ever breastfed, whether a child was given anything to drink during the first three 95 Curr. Res. J. Soc. Sci., 7(3): 94-100, 2015 Table 1: Social-demographic characteristics of mothers (n = 460) Characteristic Frequency Percent Age at a most recent birth (years) < 20 27 5.90 20 - 35 295 64.1 > 35 138 30.0 Marital status Single 95 20.7 Married/in union 347 75.4 Others 18 3.90 Education level No formal education 176 38.3 Primary education 255 55.4 Secondary+ 29 6.30 Household size <6 284 61.7 6+ 176 38.3 Parity 1 139 30.2 2-3 181 39.4 4-5 87 18.9 6+ 53 11.5 and underweight (12.9% vs. 10.7%) but girls were more wasted than boys (8.8% vs. 4.4%). The current level of stunting is lower than the national average of 42% (URT, 2010) but higher than the acceptable level of <20%. Wasting, as observed in this study, is not only higher than the national average level of 5% (URT, 2010), but also exceeds the acceptable level of <5% (WHO, 1995). This mirrors what has been reported in other studies in Tanzania (e.g., Mamiro et al., 2005; URT, 2010) that relatively few children are too thin for their height (wasting) but many are very short (stunted). Stunting is recognized as a serious public health problem because it is so common and is considered normal (Leah, 2007; Clemens and Demombynes, 2012). It is noteworthy that children who are deprived of nutrients for health growth are also deprived of nutrients for healthy brain development and health immune systems (Amsalu and Tigabu, 2008). Evidence shows associations between concurrent stunting and poor school progress or cognitive ability. For instance, studies in Tanzania, Nepal and Ghana show that stunted children, compared with non-stunted children, were less likely to be enrolled in school, more likely to enroll late and have poorer cognitive ability or achievement scores (Brooker et al., 1999; Beasley et al., 2000). Wasting is usually due to recent illness and/or insufficient dietary intake caused by food shortages, feeding practices, or other events. Wasting leads to significant weight loss; it also indicates deficit in tissue and fat mass compared with amount expected in a child of the same height or length and may result either from failure to gain weight or from actual weight loss (WHO, 2000). About one in every ten children (11.7%) was underweight (weightfor-age Z score <-2). Underweight reveals low body mass relative to chronological age, which is influenced by both, a child’s height and weight (WHO, 1995).There was a significant correlation between under weight and stunting (r = 0.509, p<0.001) and between underweight and wasting (r = 0.469, p<0.001), suggesting that a child is likely to suffer more than one form of malnutrition. (stunting) because most of the variables studied were more likely to have long-term nutritional influence on child height. Statistical significance was set at p< 0.05. A tendency to significance was accepted at 0.05< p<0.10. Ethics: Permission was sought from the Nzega District Health Department to conduct this study. Verbal consent to participate in the study was obtained from mothers to affirm their willingness to participate in the study. RESULTS AND DISCUSSION Socio-demographic characteristics: A total of 460 women participated in the study. Most of them (64.1%) were between 20 and 35 years old while 5.9% were below 20 years. The majority of the women (75.4%) were married or living with partners. More than half of them (55.4%) had completed at least grade 7 at the primary level, while 6.3% completed secondary school education or higher level (Table 1). The average household size is 6 persons, larger than the national average of 4.8 (URT, 2013). Over 39% of women had parity level of 2-3. About one tenth (11.5%) had the parity level of six or higher. Factors associated with poor nutritional status Breastfeeding practices: Inappropriate feeding practices can have profound consequences for the growth, development and survival of children. Results in Table 2 show that almost all children (98.5%) were breastfed. Although the prevalence of breastfeeding is high, appropriate breastfeeding was not always practiced. In some families, colostrum (first milk) was discarded and the onset of breastfeeding by newborns was delayed for up to more than 24 h. Only a quarter of the children (25.6%) were fed immediately after birth and this rate is low compared to 49% nationwide (URT, 2010). Delayed initiation, however, deprives infants of the nutritional benefits of colostrum and is likely to increase risks of neonatal mortality or impede optimal Nutritional status of children: The present study included 460 under-five children (219 boys and 241 girls) with overall mean age of 31.8±15.8 months. Prevalence of stunting (height- for- age Z score <-2), wasting (weight- for- height Z score <-2) and underweight (weight-for-age Z score <-2) were 26.1%, 6.5% and 11.7%, respectively. Based on the World Health Organization classification of severity of malnutrition of 1995, the overall prevalence of stunting (20-29%) and wasting (5-9%) were medium while that of underweight was high (20-29%). Compared to girls, boys were more likely to be stunted (29.9 vs. 23.7%) 96 Curr. Res. J. Soc. Sci., 7(3): 94-100, 2015 Table 2: Breastfeeding practices Variable Child ever breastfed How long after birth the child was breastfed Child was given anything to drink during the first 3 days after birth Duration of breastfeeding (months) Response Yes No Total Immediately Hours Days Total Yes No Don’t remember Total 0-12 13-18 19- 23 24+ Total Frequency 453 7 460 116 296 41 453 152 297 4 453 26 149 144 134 453 nutritional status (Edmond et al., 2006; Umam, 2012). About one third of children (33.5%) were given prelacteal feeds (i.e. giving anything to the child to drink during the first 3 days after birth).The practice of giving pre-lacteal feeds is discouraged because it limits the frequency of suckling by the infant, exposes the baby to the risk of infection and the feeds have fewer nutrients and immunological components (URT, 2010; Rogers et al., 2011). Attitudes towards initiation of breastfeeding in general and colostrum in particular, varied among respondents. Some of them were aware of the nutritious value and its importance to the newborns. Others held the view that it was necessary to discard the first milk because it could otherwise cause diarrhea. This means that use of colostrum is still surrounded by negative perceptions in the community and, therefore, awareness on the importance of breastfeeding initiation needs to be emphasized. The average duration of breastfeeding is 20.1±5.5 months and only 22.9% of mothers practice exclusive breast feeding at least in the first three months of child’s life. Mothers indicated that they were familiar with the recommendation of Exclusive Breastfeeding (EBF) for the first six months and they were aware of the nutritional values of breast milk. Nevertheless, the women raised concern over limited capacity of practicing EBF given the socio-economic conditions prevailing in their area. In particular, household food insecurity was a major constraint as only 62% of the sampled households were food sufficient throughout the year. On average, households experience food crisis for a period of 5 months during which reducing number of meals is a common coping strategy. Although causality cannot be established in a cross-sectional study, it is plausible to assume that food insecurity status would result in lower intake of healthy foods and nutrients. For breastfeeding mothers, it means not being able to produce sufficient milk which, in turn, can affect child health. Indeed, overwhelming evidence shows that lack of access to food is a major cause of malnutrition (Baro and Deubel, 2006; Hackett et al., 2009). In these circumstances, therefore, failure to practice EBF should not be interpreted as personal flaws of mothers. The Percentage 98.5 1.50 100 25.6 65.3 9.10 100 33.5 65.6 0.90 100 5.70 32.9 31.8 29.6 100 findings suggest a need for multiple sectors to work together because of the causal links that exist between health and overall economic development (Acemoglu and Johnson, 2007). Thus, sectors such as health, water, agriculture and education are important players in addressing the underlying causes of high levels of malnutrition. Socio-demographic differentials: Table 3 shows the results from the bivariate analysis using a Chi squaretest. When analyzed by sex and age, boys were found to be more stunted than girls (30.0% vs. 21.4%, χ2 = 4.434, p = 0.035) as was for older children (≥24 months) compared to the younger ones (28.5% vs 20.8%, χ2 = 6.109, p = 0.047). These results are in agreement with the findings from the previous studies (e.g., Madise et al., 1999; Wamani et al., 2005). The current findings also show that maternal characteristics have influence on child nutrition status. Stunting levels declined with increase in educational status of mothers (χ2 = 6.020, p = 0.049) and ANC visits (χ2 = 3.791, p = 0.050). The positive influences of ANC visits on child nutritional status is an indication that medical facilities and access to health services are important source of information for women and an opportunity to access health and nutrition messages. Earlier studies (e.g. Sunwoong et al., 2000; Yabanci et al., 2014) showed positive correlation between nutritional knowledge of the mothers and their nutritional status and nutritional habits and nutritional knowledge of their children. In another study, Mosha and Philemon (2010) indicated that low level of education is not only associated with understanding of nutrition and food aspects but also with indirect effects of improvement of socio-economic conditions. In this study, household size was another important determinant of malnutrition. The proportion of stunted children from households with less than 6 persons was 21.6% compared to 29.9% recorded in households with 6 persons or more (χ2 = 4.089, p = 0.043) which is possibly due to competition for available food in large households. Analysis of stunting by age group in 97 Curr. Res. J. Soc. Sci., 7(3): 94-100, 2015 Table 3: Demographic and child health related differentials of child nutritional status (stunting) Percent stunted Characteristic Number of children (ht/age<-2SD) Sex of child Male 217 30.0 Female 241 21.4 Age of child (months) 0-23 158 20.8 24+ 300 28.5 Age at a most recent birth (years) < 20 28 34.4 20 - 35 251 22.0 > 35 120 31.3 Education level of mother No formal 120 32.0 Primary 212 22.2 Secondary+ 72 21.7 Number of antenatal care visits 1-3 371 29.8 4+ 87 21.8 Family size <6 270 21.6 6+ 157 29.9 Duration of breastfeeding (months) 0-17 98 22.5 18-23 212 27.5 24+ 134 34.4 Episode of diarrhea 2weeks preceding survey Yes 114 33.1 No 363 23.5 Episode of ARI 2 weeks preceding survey Yes 57 32.8 No 420 23.6 Child received full immunization Yes 261 24.0 No 197 31.6 Improved latrine facility Yes 216 23.8 No 242 32.8 Access to safe water Yes 221 22.9 No 237 34.4 relation to the duration of breastfeeding shows that stunting was highest (27.5%) in children aged 18-23 months and lowest (22.5%) in children under age of 17 months. This observation could be due to the fact that older children often receive less attention from parents or caregivers, a behavior that could affect both the frequency and quality of meals given. χ2-value p-value 4.434 0.035 6.109 0.047 5.605 0.061 6.020 0.049 3.791 0.050 4.089 0.043 2.522 0.283 4.129 0.042 3.855 0.050 2.600 0.107 3.119 0.074 6.165 0.013 27.4%) and this is 39.8% less than the 88% Millennium Development Goal target. Under these circumstances, risks of water borne diseases are high. Where water supplies are not readily accessible, cases of diarrhoeal diseases, for example, are very common and disproportionately high among children (Checkley et al., 2004; Prüss-Üstün and Corvalán, 2006). There is a close link between water, sanitation and hygiene. WHO (2008) estimates that 50% of malnutrition is associated with diarrhoea and worm infections as a result of unsafe water, inadequate sanitation and insufficient hygiene. Diarrhoea remains the second leading cause of deaths among children under-five globally (UNICEF/WHO, 2009). In the study area, information from local health facilities reflected a similar pattern in which case diarrhoea was the leading water borne disease with prevalence of 5.5%. Limited access to other health care and environmental factors showed tendencies (0.05<p<0.10) of increased risks of stunting. These results suggest that effective nutrition interventions should take into account both the direct and indirect Health related differentials: The study also examined access to latrine facilities and safe water as well as history of diarrhoea, acute respiratory infections and immunization coverage as potential determinants of malnutrition. The results show that 47.2% of the households had non-improved latrine facilities (open pit latrine or one without slabs) which could contribute to the problem of contamination of water sources and incidence of water borne diseases. As shown, environmental factors independently associated with stunting were limited access to safe water (χ2 = 6.165, p = 0.013) and diarrhoea (χ2 = 4.129, p = 0.042). Only 48.2% of the households used improved drinking water sources (water taps, 20.8% and protected public wells, 98 Curr. Res. J. Soc. Sci., 7(3): 94-100, 2015 Edmond, K.M., C. Zandoh, M.A. Quigley, S. AmengaEtego, S.Owusu-Agyei and B.Kirkwood, 2006. Delayed breastfeeding initiation increases risk of neonatal mortality. Am. Acad. Pediatr., 117: 380-386. Fernandez, I.D., J. Himes and M.de Onis, 2002. Prevalence of nutritional wasting in populations: building explanatory models using secondary data. Bull. World Health Organ., 80: 282-291. Fisher, A.A., J.E. Laing and J.W. Townsend, 1991. Handbook for Family Planning Operations Research and Design. Operations Research, Population Council, USA. Fotso, 2007. Urban-rural differentials in child malnutrition: Trends and socioeconomic correlates in Sub-Saharan Africa. Health Place, 13(1): 205-223. Grantham-McGregor, S., Y.B. Cheung, S. Cueto, P. Glewwe, L. Richter and B. Strupp, 2007. Child development in developing countries. Developmental potential in the first 5 years for children in developing countries. Lancet, 369: 60-70. Gulat, J., 2010. Child malnutrition: Trends and issues. Anthropologist, 12(2): 131-140. Hackett, M., H.Melgar-Quiñonez and M.C.Álvarez, 2009.Household food insecurity associated with stunting and underweight among preschool children in Antioquia, Colombia. Rev. Panam. Salud. Publ., 25(6): 506-510. Leah, V., 2007. Children and vulnerability in Tanzania: A brief synthesis. Special Paper 07.25, Dar es Salaam, Research on Poverty Alleviation. Madise, N.Y., Z.Matthews and B.Margetts,1999. Heterogeneity of child nutritional status between households: A comparison of six sub-Saharan African countries. J. Demography, 53(3): 331-343. Mamiro, P., P. Kolsteren, D. Roberfroid, S. Tatala, A.S. Opsomer and J.H. Van Camp,2005. Feeding practices and factors contributing to wasting, stunting and iron deficiency anaemia among 3-23month old children in Kilosa District, Tanzania. J. Health Populat. Nutr.,23(3):222-230. Mosha, T.C.E. and N.Philemon,2010. Factors influencing pregnancy outcomes in Morogoro. Municipality, Tanzania. Tanzania J. Health Res., 12: 249-259. Muhimbula, H.S. and A.Issa-Zacharia,2010. Persistent child malnutrition in Tanzania: Risks associated with traditional complementary foods (A review). Afr. J. Food Sci., 4(11): 679-692. Niehof, A. and L.Price,2001. Rural Livelihood Systems: A Conceptual Framework. UPWARD Series on Rural Livelihoods, No.1,Wageningen. Prüss-Üstün, A. and C.Corvalán, 2006. Preventing disease through healthy environments: Towards an estimate of the environmental burden of disease. WHO Library Cataloguing-in-Publication Data, WHO. determinants of child nutritional status, including access to clean and safe water services. CONCLUSION AND RECOMMENDATIONS The present study attempted to assess the prevalence of malnutrition, identify the factors that influence child nutritional status in rural Tanzania and evaluate their importance. It shows the type of households in which children are most likely to suffer from malnutrition. The factors associated with child malnutrition range from biological attributes of children to socio-demographic, household food security, feeding practices, environmental and health related aspects. These results suggest that policies and programs aimed at reducing levels of child malnutrition should play particular attention to synergistic interventions that cut across sectors because of the diverse nature of the factors that impact child nutritional status. As shown in this and previous studies, nutritional problems are multifaceted and successful nutritional programmes need to rely on a combination of interventions. REFERENCES Acemoglu, D. and S. Johnson, 2007. Disease and development: the effect of life expectancy on economic growth. J. Polit. Econ., 115: 925-985. Akanbiemu, F., 2014. Is household food insecurity a predictor of under-five malnutrition in rural and urban communities of Ondo State, Nigeria? Proceeding of the IEA World Congress of Epidemiology, Anchorage, Alaska USA. Amsalu, S. and Z.Tigabu,2008. Risk factors for severe acute malnutrition in children under the age of five: A case-control study. Ethiopian J. Health Develop., 1: 21-25. Baro, M. and T.F.Deubel, 2006. Persistent hunger: Perspectives on vulnerability, famine and food security in Sub-Saharan Africa. Annu. Rev. Anthropol., 35:521-538. Beasley, N.M.R., A. Hall and A.M.Tomkins,2000. The health of enrolled and non enrolled children of school age in Tanga, Tanzania. Acta Trop., 76: 223-229. Brooker, S., A. Hall and D.A.P.Bundy,1999. Short stature and the age of enrolment in primary school: studies in two African countries. Soc. Sci. Med., 48: 675-682. Checkley, W., R.H. Gilman, R.E. Black, L.D. Epstein, R.N. Lilia Cabrera, C.R. Sterling and L.H. Moulton, 2004. Effect of water and sanitation on childhood health in a poor Peruvian peri-urban community. Lancet, 363(9403): 112-118. Clemens, M. and G. Demombynes, 2012. Multisector intervention to accelerate reductions in child stunting: An independent critique of scientific method. Am. J. Clin. Nutr., 95: 774-775. 99 Curr. Res. J. Soc. Sci., 7(3): 94-100, 2015 Rogers, N., J.Abdi, D.Moore, S.Nd’iangui, L.J.Smith, A.J.Carlson and D.Carlson,2011. Colostrum avoidance, prelacteal feeding and late breastfeeding initiation in rural Northern Ethiopia. Public Health Nutr., 14(11): 2029-2036. Ruel, M.T., B.de la Brie`re, K.Hallman, A.Quisumbing and N.Coj, 2002. Does subsidized childcare help poor working women in urban areas? Evaluation of a government-sponsored program in Guatemala City. Food Consumption and Nutrition Division Discussion Paper 131, International Food Policy Research Institute, Washington, DC. Smith, L.C., M.T.Ruel and A.Ndiaye, 2005. WhyiIs child malnutrition lower in urban than in rural areas? Evidence from 36 developing countries.World Dev., 33(8): 1285-1305. SunWoong, L., S.Chungja, K.Aejung and K.Mihyun,2000. A study on nutritional attitude, food behavior and nutritional status according to nutrition knowledge of Korean middle school students. Korean J. Community Nutr., 5: 419-431. Umam, F., 2012. Initiation of early and exclusive breastfeeding: Child's right. J. Exclusion Stud., 2(2): 147-154. UNICEF/WHO, 2009. Diarrhoea: Why children are still dying and what can be done?UNICEF/ WHO Report, Presented by: Camille Saadé, AED/ POUZN Director. URT(United Republic of Tanzania), 2010. Tanzania demographic and health survey. Preliminary Report, National Bureau of Statistics, United Republic of Tanzania, Measure ICF Macro, USA. URT (United Republic of Tanzania),2013.Population and housing census. National Bureau of Statistics, Tanzania. Wamani, H., A.N. Åstrom, S.Peterson, J.K.Tumwine and T.Tyllerskär, 2005. Predictors of poor anthropometric status among children under 2 of years age in rural Uganda. Public Health Nutr., 9(3): 320-326. WHO, 1995. Physical status: the use and interpretation of anthropometry. Report of a WHO Expert Committee, Technical Report Series No. 854, Geneva. WHO, 2000. Collaborative study team on the role of breastfeeding on the prevention of infant mortality: Effect of breastfeeding on infant and child mortality due to infectious diseases in less developed countries: A pooled analysis.Lancet, 355: 451-455. WHO, 2006. Child growth standards length/height-forage, weight-for-age, weight-for-length, weight-forheight and body mass index-for-age: Methods and development. World Health Organization,Geneva. WHO, 2008. SaferWater, Better Health: Costs, Benefits and Sustainability of Interventions to Promote Health. Retrieved from:http:// whqlibdoc. who. int/ publications/2008/9789241596435_eng.pdf. WHO, 2010. World Health Statistics.Retrieved from:www.who.int/gho/.../world_health_statistics/ EN_WHS10_Full.pdf. Yabanci, N., I.Kisac and S.Karakus, 2014.The effects of mother’s nutritional knowledge on attitudes and behaviors of children about nutrition. Proc.-Soc. Behav. Sci., 116: 4477-4481. You, D., G.Jones and T.Wardlaw,2012. Levels and trends in child mortality report. United Nations Inter-Agency Group for Child Mortality Estimation. 100
