Document 13310930
Int. J. Pharm. Sci. Rev. Res., 37(2), March – April 2016; Article No. 20, Pages: 114-118 ISSN 0976 – 044X
Research Article
A Validated HPTLC Method for Determination of Propyl Thiouracil in the Presence of its Impurities
Arti V. Gajbhar*, B. S. Kuchekar, V. P. Choudhari
Dept. of pharmaceutical Chemistry, MAEER’s Maharashtra Inst of Pharmacy, Ex- Serviceman Colony, Paud Road, Kothrud, Pune, India.
*Corresponding author’s E-mail: arti.gajbhar@mippune.edu.in
Accepted on: 23-02-2016; Finalized on: 31-03-2016.
ABSTRACT
In the current trend various regulatory authorities like ICH, USFDA, Canadian Drug and Health Agency are emphasizing on the identification and quantitation of impurities in Active Pharmaceutical Ingredient’s (API’s) and it is now emerging as a mandatory requirement for the new drug application. Hence their level should be controlled and monitored. Thus a simple sensitive High performance thin layer chromatographic (HPTLC) method for estimation of Propyl thiouracil and its process related impurities has been developed. Propyl thiouracil and its impurities were separated and identified on silica Gel 60 F
254
TLC plates with Hexane:
Acetone: Ethyl Acetate: Formic acid 6:4:1:0.5 (v/v) as mobile phase. The plates were developed to a distance of 8 cm and quantification was performed at λ = 254 nm. The method was validated for linearity, accuracy, precision and robustness according to
ICH guidelines. The calibration plots were linear in the range 2500-5625 and 50-112.5 ng/band for API and its three impurities respectively. Here recovery value for API and impurities were found to be in the range of 99.99 to 100.75 % with % RSD value always less than 2. Hence the developed method was found to be simple, sensitive, accurate and precise which can be used for propyl thiouracil impurity profile study and for routine analysis of propyl thiouracil from its dosage forms and for IPQC study during manufacturing of its formulations.
Keywords: Propyl thiouracil (PTU), High performance thin layer chromatography, Validation, Impurities.
INTRODUCTION
T here is an ever increasing interest in impurities present in API and Formulation. Recently, not only purity profile but also impurity profile has become essential as per various regulatory requirements. With ever increasing regulatory and compendial stringency on the control of impurities and degradation products in API and Formulations, a profound emphasis is being paid on their characterization and analysis at trace levels.
Qualification of the impurities is the process of acquiring and evaluating data that establishes biological safety of an individual impurity; thus, revealing the need and scope of impurity profiling of drugs in pharmaceutical research.
1
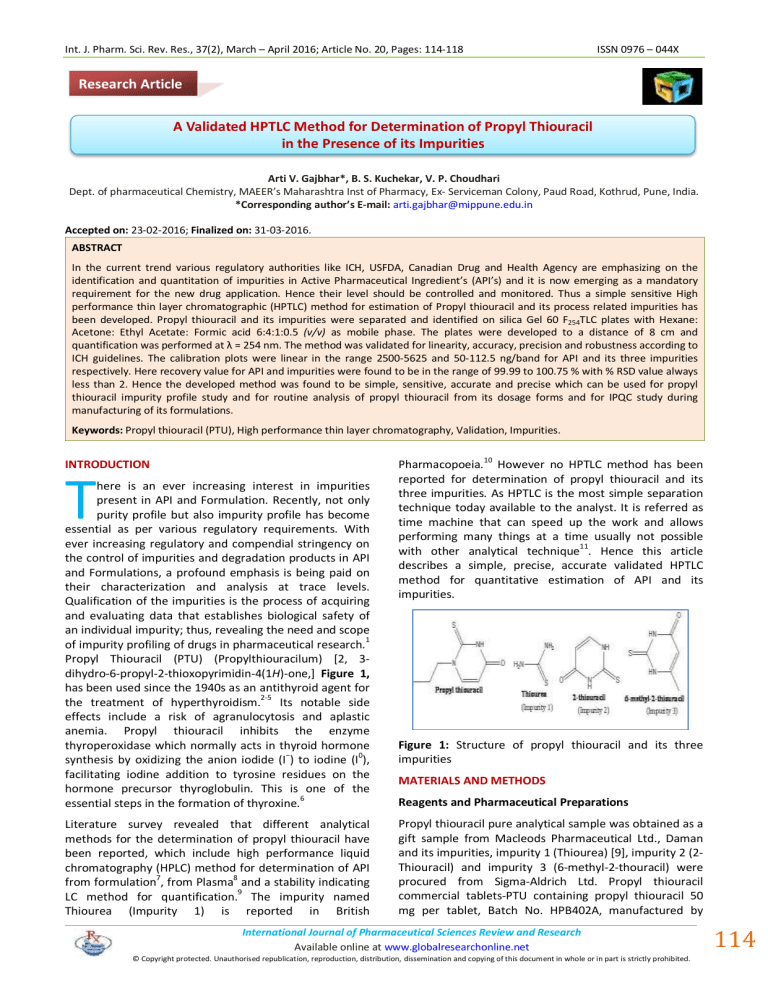
Propyl Thiouracil (PTU) (Propylthiouracilum) [2, 3dihydro-6-propyl-2-thioxopyrimidin-4(1 H )-one,] Figure 1, has been used since the 1940s as an antithyroid agent for the treatment of hyperthyroidism.
2-5
Its notable side effects include a risk of agranulocytosis and aplastic anemia. Propyl thiouracil inhibits the enzyme thyroperoxidase which normally acts in thyroid hormone synthesis by oxidizing the anion iodide (I
−
) to iodine (I
0
), facilitating iodine addition to tyrosine residues on the hormone precursor thyroglobulin. This is one of the essential steps in the formation of thyroxine.
6
Pharmacopoeia.
10
However no HPTLC method has been reported for determination of propyl thiouracil and its three impurities. As HPTLC is the most simple separation technique today available to the analyst. It is referred as time machine that can speed up the work and allows performing many things at a time usually not possible with other analytical technique
11
. Hence this article describes a simple, precise, accurate validated HPTLC method for quantitative estimation of API and its impurities.
Figure 1: Structure of propyl thiouracil and its three impurities
MATERIALS AND METHODS
Reagents and Pharmaceutical Preparations
Literature survey revealed that different analytical methods for the determination of propyl thiouracil have been reported, which include high performance liquid chromatography (HPLC) method for determination of API from formulation
7
, from Plasma
8
LC method for quantification.
9
and a stability indicating
The impurity named
Thiourea (Impurity 1) is reported in British
Propyl thiouracil pure analytical sample was obtained as a gift sample from Macleods Pharmaceutical Ltd., Daman and its impurities, impurity 1 (Thiourea) [9], impurity 2 (2-
Thiouracil) and impurity 3 (6-methyl-2-thouracil) were procured from Sigma-Aldrich Ltd. Propyl thiouracil commercial tablets-PTU containing propyl thiouracil 50 mg per tablet, Batch No. HPB402A, manufactured by
International Journal of Pharmaceutical Sciences Review and Research
Available online at www.globalresearchonline.net
© Copyright protected. Unauthorised republication, reproduction, distribution, dissemination and copying of this document in whole or in part is strictly prohibited.
114 International Journal of Pharmaceutical Sciences Review and Research
Available online at www.globalresearchonline.net
Int. J. Pharm. Sci. Rev. Res., 37(2), March – April 2016; Article No. 20, Pages: 114-118 ISSN 0976 – 044X
Macleods Pharmaceutical Ltd., Daman, India were purchased locally. All chemicals used were of Analytical reagent grade including methanol, hexane, acetone, ethyl acetate, formic acid and purchased from Research Lab
Fine Chem Industries, Mumbai.
Standard and Sample solution preparation
Standard Solution: Standard stock solution containing
1000 µg/mL of propyl thiouracil was prepared in methanol by weighing 10 mg of API dissolving it in sufficient quantity of methanol and finally volume was made up to 10 mL with methanol.
Similarly working standard for the three impurities, i.e impurity 1 (Thiourea), impurity 2 (2-Thiourasil) and impurity 3 (6-methyl-2-thiouracil) was prepared having concentration of 100 µg/mL in methanol.
Mixed standard solution: From the above standard solution propyl thiouracil (1000 µg/mL) 10 ml was taken and to it 2 ml of stock solution (100 µg/mL) of each impurities was added to get the mixed standard solution of API and impurities. From this solution equivalent volume was spotted on plate to give the desired concentration of API and impurities.
Sample Solution: Twenty PTU tablets were weighed and powdered and quantity of powder equivalent to 100 mg was weighed and transferred to 100 mL volumetric flask.
The powder was dissolved in methanol by sonication for 5 min, the solution was filtered through a whatmann filter paper no. 41 and finally volume was made with the methanol. Further from the above stock solution 5 mL was diluted to 50 mL with methanol to get the solution containing 100 µg/mL of propyl thiouracil.
Chromatography
Chromatography was performed on 20 x10 cm aluminium backed silica gel 60 F
254
TLC plates (Merck, Darmstadt,
Germany). Before use, the plates were washed with methanol and activated at 110 °C for 5 min. Hexane:
Acetone: Ethyl acetate: Formic acid, 6:4:1:0.5 ( v/v ) were used as the mobile phase. Samples (5 µL) were applied to the plates as 6 mm bands, keeping 17.7 mm distance between bands and 8 mm distance from plate side edge and 8 mm distance from bottom of plate. CAMAG
(Muttenz Switzerland) Linomat V was used as sample applicator equipped with 100 µL syringe (Hamilton, Reno,
Nevada, USA) with the spraying rate as 150 nL/sec. The plates were developed in CAMAG 20 x 10 cm twin trough chamber lined with filter paper and saturated with mobile phase vapors for 10 min at room temperature. The solvent front position was set as 80 mm. After development of the plate in the mobile phase, it was dried in hot air oven at 50°C for 5 min. Densitometric scanning of the developed plate was performed at wavelength λ= 254 nm using CAMAG TLC scanner III with win CATS Software and deuterium lamp as light source with the slit dimension 4.00 x 0.30 mm and scanning speed of 20 mm/s.
Optimization of Method
HPTLC procedure was optimized to develop a method for identification and quantification of drug and its three impurities simultaneously. Firstly from the literature survey, Chloroform: 2-propanol: Glacial acetic acid
(50:6:0.1 v/v )
11
, was tried but in this mobile phase the bands were observed near to the baseline. So again another mobile phase containing Hexane: Acetone:
Methanol (6:2:0.5 v/v ) was tried, here only API got separated but three impurities were not moving at all.
The next trial was done with Hexane: Acetone (5:5 v/v ) as the mobile phase, but in this case drug was moving sufficiently but impurities were not at all resolved. Hence it was concluded that, one has to select the mobile phase containing compulsorily Hexane and acetone, but along with that another one composition of solvent need to be included which is less polar as compared to methanol.
Hence mobile phase containing Hexane: Acetone: Ethyl acetate (6:4:0.5 v/v ) was tried but in this, impurities got moved but peaks were not well resolved. After this the next mobile phase selected was Hexane: Acetone: Ethyl acetate (6:4:1 v/v ), but here all peaks were well resolved with tailing effect. Hence finally mobile phase containing
Hexane: Acetone: Ethyl acetate: Formic acid (6:4:1:0.5 v/v ) was tried to reduce the tailing effect. This mobile phase showed well resolved peaks of drug and its three impurities with the reproducible results. So the method was said to be optimized.
Method Validation
The method was validated for accuracy, precision, linearity, specificity and robustness in analytical solution, in accordance with ICH guidelines.
12-14
Linearity
The equivalent volume of mixed standard solution (4-9
μL) was spotted on plate to cover the range of and 2500-
5625 ng per band and 50 to 112.5 ng per band of standard drug and its three impurities. Chromatographic plates were developed using optimized procedure and scanned as described above. The peak areas were recorded for propyl thiouracil and its impurities. A good linear relationship between response (peak area) and concentration was obtained. As the calibration can be accepted as linear, only if it is proven statistically hence to prove the linearity of the data; non numerical test method (testing the residuals) was performed.
15,16
Method sensitivity (LOD and LOQ)
Calibration plot for API and its three impurities was performed three times and its standard deviation and mean slope was calculated. All this data was processed as per the formula for limit of detection LOD and limit of quantitation LOQ given as LOD= 3.3x σ/S and LOQ=10x
σ/S, where σ is standard deviation and S is slope of calibration plot.
International Journal of Pharmaceutical Sciences Review and Research
Available online at www.globalresearchonline.net
© Copyright protected. Unauthorised republication, reproduction, distribution, dissemination and copying of this document in whole or in part is strictly prohibited.
115 International Journal of Pharmaceutical Sciences Review and Research
Available online at www.globalresearchonline.net
Int. J. Pharm. Sci. Rev. Res., 37(2), March – April 2016; Article No. 20, Pages: 114-118 ISSN 0976 – 044X
Assay
For the assay from the sample solution the equivalent volume was spotted to obtain the concentration 3750 ng/band. The same procedure was repeated 3 times and plate was developed and scanned using the optimized procedure. The area under curve for the sample solution was compared with the data of calibration curve and the
% assay was calculated.
Accuracy (Recovery)
As the drug was qualifying the assay, the validation was performed with the first parameter as accuracy. The accuracy of the method was determined by calculating recoveries of propyl thiouracil and its impurities by the standard addition method. Recovery was performed at three levels i.e. 80, 100 and 120 %. Known amount of standards were spiked to the sample to get the concentration as 3125, 3750 and 4370 ng per band.
Similarly known amount standard impurities (62.5, 75,
87.5 ng per band) were spiked to the sample solution of impurities. The amount of Propyl thiouracil and its impurities were determined by measuring the peak areas.
Precision
For the precision both repeatability and reproducibility of the method for drug and its impurities was checked. For repeatability the peak area of sample band was measured repeatedly (n=6) and the relative standard deviation was calculated. For intermediate precision, the peak area of sample at three different concentration were measured for three times (n=3) on the same day for intraday precision. For inter day precision the peak area was measured for three times (n=3) on different day and the relative standard deviation was calculated.
Robustness
To study the method robustness the parameters which were changed deliberately include volume of mobile phase, saturation time, composition of mobile phase, TLC plate form different lot and time from spotting to development and development to scanning. By changing the above parameters the peak area of the API and its impurities were recorded. Robustness of method for each parameter change was assessed by using % assay of analyte and its R f
value.
Specificity
The specificity of the method was determined by analyzing standard drug, test sample and its three impurities. The spot for Standard, sample drug and impurities was confirmed by comparing the R f
and spectrum of the spot to that of a standard. The peak purity was determined by comparing R value of the spectrum at different regions of the spot, i.e, peak start
(S) to peak apex (M) and peak apex (M) to peak end (E).
RESULTS AND DISCUSSION
Linearity
Linearity between concentrations and response was checked as described in earlier section. Calibration curves were obtained for propyl thiouracil and its 3 impurities from which linear regression equation was computed and a correlation coefficient was obtained. Linear regression data for the calibration plots (n = 3) are listed in Table 1.
The correlation coefficient was found to be in the range of 0.997-0.999 for all the components, which shows excellent linearity between the concentration and response. From non numerical test; the plot of residuals was obtained which doesn’t show any trend in it that implies results are satisfactory. This proves the linearity of calibration.
Method sensitivity (LOD and LOQ)
Method sensitivity was performed as explained in section
2.4.2. The LOD and LOQ were found to be 191.1 ng and
580.09 ng for API and 3.26, 9.89 for Impurity 1, 2.08, 6.31 ng for impurity 2 and 1.08, and 3.28 ng for impurity 3 respectively (Table 1). The low values of LOD and LOQ reveals that the method is sensitive (Figure 2).
Figure 2: Densitogram of Propyl Thiouracil (PTU) with its impurities
Assay
The drug content obtained from standard and the sample was found to be comparable with no interference from excipients commonly present in tablet. The R f
value was found to be 0.48 (Figure 3) and the assay value was found to be 100.07 % and % RSD value as 0.95. The result indicates that the method is suitable for routine analysis of PTU and its impurities in pharmaceutical dosage form.
Figure 3: Densitogram of PTU tablet
International Journal of Pharmaceutical Sciences Review and Research
Available online at www.globalresearchonline.net
© Copyright protected. Unauthorised republication, reproduction, distribution, dissemination and copying of this document in whole or in part is strictly prohibited.
116 International Journal of Pharmaceutical Sciences Review and Research
Available online at www.globalresearchonline.net
Int. J. Pharm. Sci. Rev. Res., 37(2), March – April 2016; Article No. 20, Pages: 114-118 ISSN 0976 – 044X
Accuracy Precision
The accuracy was performed as described in section 2.4.3 by standard addition method at three level i.e 80%, 100%,
120 %. The % recovery was found in the range of 99.99–
100.75% and % RSD value was less than 2 for PTU and all the 3 impurities (Figure 4). The result shows that the method is accurate (Table 2).
The precision was performed as described in section
2.4.4. To check the repeatability, the response of sample solution was recorded six times for three different concentrations. The intraday and inter day precision was performed as per the procedure given in earlier section.
The results are as shown in Table 3.
Table 1: Linear Regression data for the calibration plot (n=3) and Method Sensitivity
Linearity Range (ng)
Correlation Coefficient
Slope
Intercept
LOD (ng)
LOQ (ng)
PTU
2500-5625
0.999
1044
1142
191.1
580.09
Impurity 1
50-112.5
0.997
0.508
-1.83
3.26
9.89
Impurity 2
50-112.5
0.999
1.856
1.52
2.08
6.31
Impurity 3
50-112.5
0.998
1.479
20.26
1.08
3.28
Spike level
80 %
100 %
120 %
PTU
100.26
100.51
100.13
Table 2: Recovery Study (n=6)
Mean % Recovery
Impurity 1
100.63
100.75
100.63
Impurity 2
100.31
100.36
100.34
Impurity 3 PTU Impurity 1
99.99 1.13 0.65
100.03
100.07
1.17
1.19
0.63
0.56
% RSD
Impurity 2
0.95
0.98
0.96
Impurity 3
0.96
0.97
0.93
Concentration PTU
(ng/band) 3125 3750
Intra day (% RSD) 1.29 1.78
Inter day (% RSD) 1.75 1.64
4370
1.91
1.62
Table 3: Precision Study (n=3)
Impurity 1
62.5 75
1.65 1.62
1.89 1.91
87.5
1.57
1.94
62.5
1.11
0.98
Impurity 2
75 87.5
1.21 1.25
0.95 0.96
Impurity 3
62.5
1.32
75
1.3
1.03 0.99
87.5
1.27
1.1
Parameter
Table 4: Results of Robustness study
Volume of mobile phase (±1 mL)
Time of saturation (±5 min)
Composition of mobile phase
Hexane (±0.1 mL)
Time from application to chromatography
Time from chromatography to scanning
Plate from different lot: Lot HX007716
Plate from different lot: Lot HX007511
PTU
% Assay, % RSD
99.70, 1.02
99.85, 1.25
99.58, 1.5
99.45, 0.99
99.25, 1.2
101.2, 0.95
99.39, 1.03
Impurity 1
% Assay, % RSD
99.56, 0.99
99.75, 1.06
Impurity 2
% Assay, % RSD
99.67, 1.12
100.5, 0.98
99.69, 1.5
99.86, 0.89
99.63, 1.56
99.37, 0.68
101.42, 0.28
101.2, 1.6
101.02, 0.85
101.07, 1.7
100.16, 0.97
100.32, 1.2
Impurity 3
% Assay, % RSD
100.45, 0.97
100.6, 1.09
100.85, 1.4
101.4, 1.05
99.67, 1.23
100.19, 0.99
100.01, 1.26 r,s,m r,m,e
PTU
0.999884
0.999576
Table 5: Peak purity values
Impurity 1
0.999825
0.999936
Impurity 2
0.999852
0.999801
Impurity 3
0.999979
0.999983
International Journal of Pharmaceutical Sciences Review and Research
Available online at www.globalresearchonline.net
© Copyright protected. Unauthorised republication, reproduction, distribution, dissemination and copying of this document in whole or in part is strictly prohibited.
117 International Journal of Pharmaceutical Sciences Review and Research
Available online at www.globalresearchonline.net
Int. J. Pharm. Sci. Rev. Res., 37(2), March – April 2016; Article No. 20, Pages: 114-118 ISSN 0976 – 044X
Figure 4:
Robustness
Densitogram of PTU and its 3 impurities
Statistical analysis reveals that there is no significant difference between results obtained by applying some deliberate changes in the experimental conditions. Thus method was found to be robust. Table 4 shows the result of robustness study. (Table 4)
Specificity
Well resolved peaks were obtained for PTU and its impurities (Figure 5). The values of peak purity are found to be in the range of 0.999801 to 0.999979 (Table 5) which shows that the method is specific for the determination of impurities and drug simultaneously.
Table 5 shows the values of peak purity.
Figure 5: Peak purity overlain spectra of Standard PTU & its impurities
CONCLUSION
A simple, Specific, accurate, precise, robust and sensitive
HPTLC method is developed. This method can be used in routine analysis of Propyl thiouracil in presence of its impurities which will serve as a quality control tool for the routine analysis of API and formulation. The method is reported first time & is novel. HPTLC is the fastest chromatographic technique and it gives more information of sample. HPTLC technique is most suited for impurity profile of drug substances as per the compendial specifications.
REFERENCES
1.
Alsante K M, Boutres P, Couturier M A, Fridmann R C, Harwood J
W, Horan G J, Jensen A J, Liu Q, Lohr L L, Morris R, Raggon J W,
Reid G L, Santafianos D P, Sharp T R, Tucker J L and Wilcox G E,
Pharmaceutical impurity identification: a case study using a multidisciplinary approach. Journal of Pharmaceutical Sciences,
93(9), 2004, 2296.
2.
European Pharmacopoeia 6.0, Vol II, Published by Directorate for the Quality of Medicines and Health Care of the council of Europe
[EDGM], 2331-2332.
3.
Indian Pharmacopoeia, Published by Indian Pharmacopoeia
Commission, Ghaziabad, Vol III, 2014, 2585-2586.
4.
The Pharmacopoeia of Japan 2011, 16 th
Ed., Published by
Pharmaceutical & Medical device regulatory science society of
Japan, 1315-1316.
5.
Pharmacopoeia of the people’s republic of China, Published by
China medical science press China, Vol II, 2010, 1023-1024.
6.
Boron, WF & Boulpaep, EL. Medical Physiology, Updated Edition .
Elsevier Saunders, Philadelphia, PA, (2005).
7.
Ahmad M. Abdul-Fattah and Hridaya N. Bhargava, Development and Validation of a High-Performance Liquid Chromatographic
Method for the Analysis of Propylthiouracil in Pharmaceuticals,
Drug Development and Industrial Pharmacy, 27(8), 2001, 831-835.
8.
H G Giles, R Miller, E M Sellers , High performance liquid chromatographic determination of plasma propylthiouracil,
Journal of Pharmaceutical Sciences, 68(11), 1979, 1459-60.
9.
Parmar Manoj D, Rao DVN, Nimavat Kiran, Vyas Kartic, J. Atoms and Molecules, 3(1), 2013, 454–462.
10.
British Pharmacopoeia, Published by The Stationary Office,
London, Vol II, 2011, 1834-1835.
11.
Sethi P. D., HPTLC, (Quantitative Analysis of Pharmaceutical
Formulations), 1 st
Ed., CBS Publishers & Distributors, New Delhi, 1-
63.
12.
International conference on harmonization, ICH Q2(R1)Validation of Analytical Procedures : Text and Methodology, Current Step 4 version (Complementary Guideline on Methodology dated 6
November 1996 incorporated in November 2005).
13.
International conference on harmonization, ICH Q3A (R2)
IMPURITIES IN NEW DRUG SUBSTANCES Q3A(R2) Current Step 4 version dated 25 October 2006.
14.
International conference on harmonization, ICH Q 3B (R2)
IMPURITIES IN NEW DRUG PRODUCTS Q3B (R2) Current Step 4 version dated 2 June 2006.
15.
David. M. Bliesner, Validating chromatographic methods,
Published by Wiley Interscience.
16.
Katalin Ferenczi-Fodor, Bernd Renger, and Zoltán Végh, The
Frustrated Reviewer - Recurrent Failures in Manuscripts Describing
Validation of Quantitative TLC/HPTLC Procedures for Analysis of
Pharmaceuticals, Journal of Planar Chromatography, 23, 2010, 3,
173–179.
Source of Support: Nil, Conflict of Interest: None.
International Journal of Pharmaceutical Sciences Review and Research
Available online at www.globalresearchonline.net
© Copyright protected. Unauthorised republication, reproduction, distribution, dissemination and copying of this document in whole or in part is strictly prohibited.
118 International Journal of Pharmaceutical Sciences Review and Research
Available online at www.globalresearchonline.net
