Document 13309739
advertisement
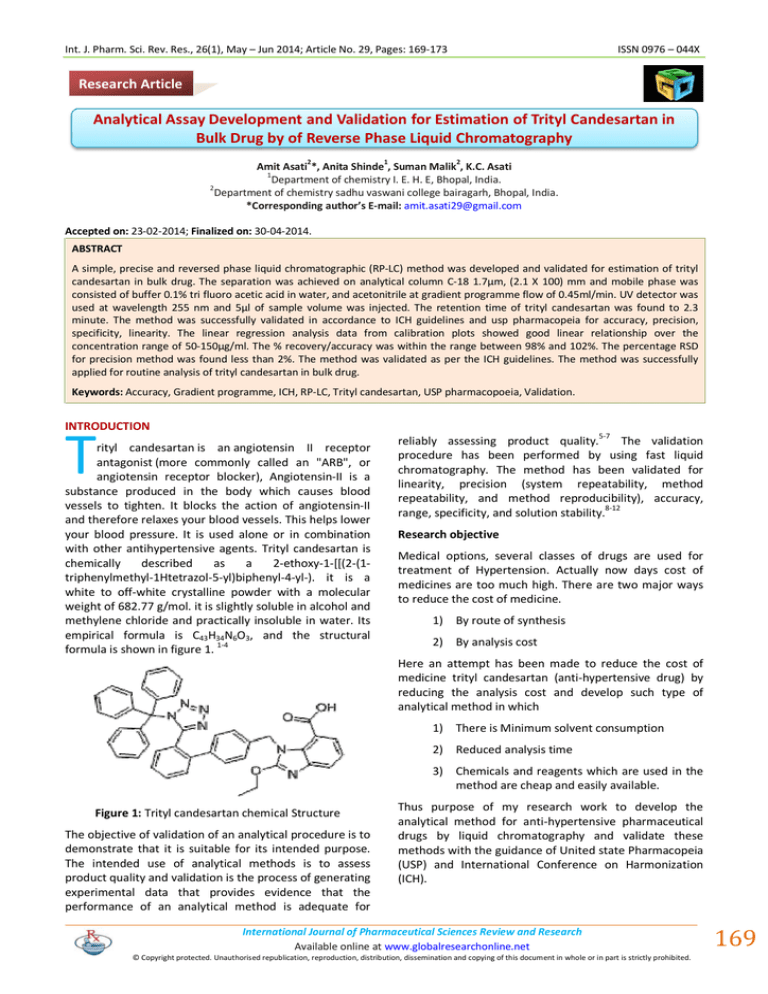
Int. J. Pharm. Sci. Rev. Res., 26(1), May – Jun 2014; Article No. 29, Pages: 169-173 ISSN 0976 – 044X Research Article Analytical Assay Development and Validation for Estimation of Trityl Candesartan in Bulk Drug by of Reverse Phase Liquid Chromatography 2 1 2 Amit Asati *, Anita Shinde , Suman Malik , K.C. Asati 1 Department of chemistry I. E. H. E, Bhopal, India. 2 Department of chemistry sadhu vaswani college bairagarh, Bhopal, India. *Corresponding author’s E-mail: amit.asati29@gmail.com Accepted on: 23-02-2014; Finalized on: 30-04-2014. ABSTRACT A simple, precise and reversed phase liquid chromatographic (RP-LC) method was developed and validated for estimation of trityl candesartan in bulk drug. The separation was achieved on analytical column C-18 1.7µm, (2.1 X 100) mm and mobile phase was consisted of buffer 0.1% tri fluoro acetic acid in water, and acetonitrile at gradient programme flow of 0.45ml/min. UV detector was used at wavelength 255 nm and 5µl of sample volume was injected. The retention time of trityl candesartan was found to 2.3 minute. The method was successfully validated in accordance to ICH guidelines and usp pharmacopeia for accuracy, precision, specificity, linearity. The linear regression analysis data from calibration plots showed good linear relationship over the concentration range of 50-150µg/ml. The % recovery/accuracy was within the range between 98% and 102%. The percentage RSD for precision method was found less than 2%. The method was validated as per the ICH guidelines. The method was successfully applied for routine analysis of trityl candesartan in bulk drug. Keywords: Accuracy, Gradient programme, ICH, RP-LC, Trityl candesartan, USP pharmacopoeia, Validation. INTRODUCTION T rityl candesartan is an angiotensin II receptor antagonist (more commonly called an "ARB", or angiotensin receptor blocker), Angiotensin-II is a substance produced in the body which causes blood vessels to tighten. It blocks the action of angiotensin-II and therefore relaxes your blood vessels. This helps lower your blood pressure. It is used alone or in combination with other antihypertensive agents. Trityl candesartan is chemically described as a 2-ethoxy-1-[[(2-(1triphenylmethyl-1Htetrazol-5-yl)biphenyl-4-yl-). it is a white to off-white crystalline powder with a molecular weight of 682.77 g/mol. it is slightly soluble in alcohol and methylene chloride and practically insoluble in water. Its empirical formula is C43H34N6O3, and the structural formula is shown in figure 1. 1-4 reliably assessing product quality.5-7 The validation procedure has been performed by using fast liquid chromatography. The method has been validated for linearity, precision (system repeatability, method repeatability, and method reproducibility), accuracy, range, specificity, and solution stability.8-12 Research objective Medical options, several classes of drugs are used for treatment of Hypertension. Actually now days cost of medicines are too much high. There are two major ways to reduce the cost of medicine. 1) By route of synthesis 2) By analysis cost Here an attempt has been made to reduce the cost of medicine trityl candesartan (anti-hypertensive drug) by reducing the analysis cost and develop such type of analytical method in which 1) There is Minimum solvent consumption 2) Reduced analysis time 3) Chemicals and reagents which are used in the method are cheap and easily available. Figure 1: Trityl candesartan chemical Structure The objective of validation of an analytical procedure is to demonstrate that it is suitable for its intended purpose. The intended use of analytical methods is to assess product quality and validation is the process of generating experimental data that provides evidence that the performance of an analytical method is adequate for Thus purpose of my research work to develop the analytical method for anti-hypertensive pharmaceutical drugs by liquid chromatography and validate these methods with the guidance of United state Pharmacopeia (USP) and International Conference on Harmonization (ICH). International Journal of Pharmaceutical Sciences Review and Research Available online at www.globalresearchonline.net © Copyright protected. Unauthorised republication, reproduction, distribution, dissemination and copying of this document in whole or in part is strictly prohibited. 169 Int. J. Pharm. Sci. Rev. Res., 26(1), May – Jun 2014; Article No. 29, Pages: 169-173 Literature review Literature survey indicates that there is no RP-LC short run time method available for assay determination of trityl candesartan in bulk drug.13-14 thus we aimed to develop it. Reverse phase Liquid chromatography is a modern separation technique. Basic principle of chromatography depends on the distribution of the mixture between two phase, one of them is called Stationary phase and other mobile phase. The mixture is dissolved in the moving phase and passed over a stationary phase. When a mixture of components is introduced into column, they travel according to their relative affinities towards the stationary phase. The component which has more affinity towards stationary phase travels slower. The component which has less affinity towards the stationary phase travels faster. Since no two components have the same affinity towards the stationary phase, the components are separated.15-16 ISSN 0976 – 044X about 15mL of diluent and sonicated to dissolve it completely and make volume up to the mark with the same. Further pipette out 5mL of the above stock solution into a 50mL volumetric flask and dilute up to the mark with diluent. Mix well and filter through 0.22µm filter. Obtain solution concentration was 100µg/ml. These solutions were injected into LC system to determine and measure the Peak area of trityl candesartan and calculate % trityl candesartan by following formulae. Calculation A1 X C2 Trityl candesartan (%) = ---------------- X P A2 X C1 Where, A1 = Area of Trityl Candesartan in sample MATERIALS AND METHODS A2 = Area of Trityl Candesartan in standard Chemical and Reagents Pure samples of trityl candesartan were obtained as gift. LC grade acetonitrile and trifluoro acetic acid were purchased from Merck Company Mumbai. High purity deionised water was obtained from millipore purification system. Instrumentation and chromatographic conditions The analysis of the drug was carried out on a waters acquity UPLC (ultra performance liquid chromatography) binary gradient system, 10µl injection loop column with auto injector. Column compartment having temperature control and for detection Ultraviolet Detector was employed throughout the analysis. Acquity BEH C-18 1.7µ, (2.1 X 100) mm, analytical column was used for separation. Mobile phase was consisted of buffer 0.1% trifluoro acetic acid in water, and acetonitrile. The mobile phase was prepared freshly and degassed by sonicating for 5 minutes before use. Acetonitrile was used as diluent. The analysis was done on gradient programme flow of 0.45ml/min. UV detector was used for detection at 255 nm at column temperature 40°C using 5.0 µL injection volumes with auto injector. Total Detector run time is 3.0 min and 2.0 min equilibration time. Standard solution Preparation Accurately weigh and transfer 20mg of trityl candesartan working standard into a 20mL volumetric flask, add about 15mL of diluent and sonicated to dissolve it completely and make volume up to the mark with the same. Further pipette out 5mL of the above stock solution into a 50mL volumetric flask and dilute up to the mark with diluent. Mix well and filter through 0.22µm filter. Obtain solution concentration was 100µg/ml. Sample solution preparation Accurately weigh and transfer equivalent to 20mg of trityl candesartan sample into a 20mL volumetric flask, add C1 = Concentration of Trityl Candesartan in sample (mg/ml) C2 = Concentration of Trityl Candesartan in Standard (mg/ml) P = Potency of Standard RESULTS AND DISCUSSION Method validation The objective of the method validation is to demonstrate that the method is suitable for its intended purpose as it is stated in ICH guidelines. The method was validated for linearity, precision (repeatability and intermediate precision), accuracy, specificity, stability and system suitability. Linearity The linearity of an analytical procedure is its ability to elicit test results that are directly proportional to the concentration of analyte in the sample within a given range. It should be established initially by visual examination of a plot of signals as a function of analyte concentration of content. If there appears to be a linear relationship, test results should be established by appropriate statistical methods (e.g., by calculation of a regression line by the method of least squares). In some cases, to obtain linearity between the response of an analyte and its concentration, the test data may have to be subjected to a mathematical transformation. Data from the regression line itself may be helpful for providing mathematical estimates of the degree of linearity. The correlation coefficient, y-intercept, slope of the regression line, and residual sum of squares should be submitted. Five standard solutions of trityl candesartan were prepared from three stocks in the range of 50% to 150% International Journal of Pharmaceutical Sciences Review and Research Available online at www.globalresearchonline.net © Copyright protected. Unauthorised republication, reproduction, distribution, dissemination and copying of this document in whole or in part is strictly prohibited. 170 Int. J. Pharm. Sci. Rev. Res., 26(1), May – Jun 2014; Article No. 29, Pages: 169-173 of the nominal concentration and injected once. Linearity regression analysis demonstrated the acceptability of the method for quantitative determination of trityl candesartan over the concentration range of about 50ppm to 150ppm of the nominal concentration. Linearity graph was shown in figure 2 and slope, intercept and correlation factor were shown in table 1. Figure 2: The linear relationship between concentration (ppm) of sample and relative response (area of trityl condesartan) Table 1: The Linear relationship data and obtained outcome slop, intercept and correlation factor Trityl Candesartan Concentration (ppm) Trityl Candesartan Area 50.17ppm 667788 80.27ppm 1056414 100.04ppm 1318249 119.10ppm 1580334 148.87ppm 1962049 Slope 13163431 Intercept 4695 Correlation factor 0.9999 Precision The precision of an analytical method is the degree of agreement among individual test results when the method is applied repeatedly to multiple samplings of a homogeneous sample. The precision of an analytical method is usually expressed as the standard deviation or relative standard deviation (coefficient of variation) of a series of measurements. Precision may be a measure of either the degree of reproducibility or repeatability of the analytical method under normal operating conditions. The ICH documents recommend that repeatability should be assessed using a minimum of nine determinations covering the specified range for the procedure (i.e., three concentrations and three replicates of each concentration, or a minimum of six determinations at 100% of the test concentration). Method repeatability Six preparation of trityl candesartan sample was analyzed from sample preparation to final results by the same ISSN 0976 – 044X analyst and the percentage RSD of obtained results was less than 2% and obtained result were within given range 100 ± 2. Results are presented in table 2. Table 2: Method Repeatability of trityl candesartan (six different preparations of same sample) Method Repeatability Concentration (ppm) Retention time (min) Area % Trityl Candesartan 99.84 2.335 1318249 99.9 99.45 2.334 1320879 100.1 100.29 2.334 1322246 99.8 100.54 2.333 1333770 100.4 100.88 2.332 1332837 100.0 99.74 2.333 1317429 100.0 Average 2.334 100.0 STDEV 0.001 0.212 %RSD <0.1 0.2 System Repeatability Standard solution is prepared 100ppm were injected in six times and RSD of areas and retention times were calculated. The percentage RSD of areas was obtained less than 2.0% and the % RSD of retention times was obtained less than 5.0 %. System Reproducibility Three Trityl Candesartan sample are analysed by this method in duplicate preparation and obtain results are average of two preparations 100.0%, 99.9% and 99.5%. Accuracy It is defined as the closeness of test results obtained by the method to the true value. It may often be expressed as percent recovery by the assay of known, added amounts of analyte. Accuracy is a measure of the exactness of the analytical method. The ICH documents recommend that accuracy be assessed using a minimum of nine determinations over a minimum of three concentration levels, covering the specified range (i.e., three concentrations and three replicates of each concentration). The three different concentrations of Trityl Candesartan standard solutions were determined from three replicate injections, using the linear regression lines (linearity section). The deviations of the obtained results (expressed as percentage accuracy) were calculated from the true values were presented in table 3. Specificity The ICH documents define specificity as the ability to assess unequivocally the analyte in the presence of components that may be expected to be present, such as impurities, degradation products, and matrix components. In an assay, demonstration of specificity requires that it can be shown that the procedure is unaffected by the presence of impurities or excipients. In International Journal of Pharmaceutical Sciences Review and Research Available online at www.globalresearchonline.net © Copyright protected. Unauthorised republication, reproduction, distribution, dissemination and copying of this document in whole or in part is strictly prohibited. 171 Int. J. Pharm. Sci. Rev. Res., 26(1), May – Jun 2014; Article No. 29, Pages: 169-173 practice, this can be done by spiking the drug substance or product with appropriate levels of impurities or excipients and demonstrating that the assay result is unaffected by the presence of these extraneous materials. The specificity of the method was verified by ISSN 0976 – 044X testing the blank, standard and sample (un-spiked and spiked), determined the resolution factors between analyte peak (Trityl Candesartan) and the nearest peak. Sample of Trityl Candesartan sample spiked with other known impurity. Table 3: Accuracy test data of Trityl Candesartan at three different level (80ppm, 100ppm and 120ppm) Area Calculated concentration (ppm) Accuracy (%) 1056414 79.897 99.53 1057732 79.997 99.66 3 1059233 80.111 99.80 Average 1057793 1 1318249 99.788 Injection No Level Concentration(ppm) 1 2 2 80 % 99.75 1320879 99.988 99.95 1322246 100.09 100.05 Average 1320458 1 1580334 119.70 100.50 1572326 119.09 99.99 3 1569189 118.85 99.79 Average 1573950 120 % 100.04 99.7 3 2 100 % 80.27 119.10 99.9 100.1 The average deviations from true value are less than 2.0 %. No significant interfering peak appeared in the blank, System suitability and standard chromatogram at the retention times of the analyte peaks. Range The range obtained from Linearity, Precision and Accuracy is summarized - ibesartan-50ppm to 150ppm (50% to 150% of nominal sample concentration) Solution Stability Figure 4: Typical System Suitability Chromatogram with all known impurities (these all impurity are well resolved with trityl candesartan) The time period and storage conditions of testing the stability of standard and sample solutions will be according to accumulated knowledge. Stability shall be verified in the glassware specified for the particular solution in the method, e.g. transparent or amber glass. Solution stability was verified by retesting the solutions after 4 hours stored in transparent vials. The stability of the solution was evaluated by calculating the differences between the obtained results of solution stored in vials at room temperature with the freshly prepared solution results. The comprehensive results of this study are 99.20% and 99.42% in the old and fresh preparation solution respectively and % difference is 0.2%. No new degradation peak was observed. The obtained results are showed good stability of the sample solution stored at room temperature in vial for at least 4 hours. CONCLUSION Figure 5: Typical Standard Chromatogram (100ppm) The method validation demonstrated that The Method “Determination of Trityl Candesartan Assay content by liquid Chromatography is selective, precise, linear, and accurate for performing the determination over the International Journal of Pharmaceutical Sciences Review and Research Available online at www.globalresearchonline.net © Copyright protected. Unauthorised republication, reproduction, distribution, dissemination and copying of this document in whole or in part is strictly prohibited. 172 Int. J. Pharm. Sci. Rev. Res., 26(1), May – Jun 2014; Article No. 29, Pages: 169-173 required concentration ranges of 50 to150 % of Trityl Candesartan nominal sample concentration. 9. Uddin S, Rauf A, Kazi T, Afridi HI, Lutfullah G, Highly sensitive spectrometric method for determination of hydroquinone in skin lightening creams: application in cosmetics, International journal of cosmetic science, 33, 2011, 132-137. 10. Ayad HM, Abdellatef HE, Sayed HM, Spectrophotometric determination of levonorgestrel, norethisterone acetate, mometasone furoate and fluticasone propionate using 4amino-antipyrine, Bull Fac Pharm Cairo Univ., 35, 2005. 11. Goyal S, Arora S, Bhatt TK, Das P, Sharma A, Kumari S, Arya DS, Modulation of PPAR-γ by telmisartan protects the heart against myocardial infarction in experimental diabetes, Chem Biol Interact., 185(3), 2010, 271-280. 12. Palled MS, Chatter M, Rajesh PMN, Bhatt AR, Difference Spectrophotometric determination of telmisartan in tablet dosage forms, Indian Journal of Pharmaceutical Sciences, 68, 2006, 685-686. 13. Santanu M, Kshirsagar M, Vipin S, Spectrophotometric method for simultaneous estimation of tretinoin and curcumin combination in pure form, International Research Journal of Pharmacy, 9, 2011, 151-152. 14. ICH-Guidelines Q2A, Validation of Analytical Procedures: Definition and terminology Geneva, Switzerland, 1995. 15. Shah NJ, Suhagia BN, Shah RR, Shah PB, Development and validation of a HPTLC method for the simultaneous estimation of telmisartan and hydrochlorothiazide in tablet dosage form. Indian Journal of Pharmaceutical Sciences, 69, 2007, 202-205. 16. Ben-Mei C, Yi-Zeng L, Ya-Li W, Fu-Liang D, Fang-Qiu G, LanFang H, Development and validation of LC-MS method for the determination of telmisartan in human plasma, Analytica Chimica Acta, 540, 2005, 367-373. REFERENCES 1. 2. 3. 4. 5. Benson SC, Identification of telmisartan as unique angiotensin II receptor antagonist with selective PPAR gamma-modulating activity, Hypertension, 43, 2004, 9931002. th European Pharmacopeia 7 edition; Vol.2 European Directorate for the Quality of Medicines and Healthcare, 2011, 2523-2524, 3125-3126. Polinko M, Riffel K, Song H, Lo MW, Simultaneous determination of losartan and EXP3174 in human plasma and urine utilizing liquid chromatography/tandem mass spectrometry, J Pharm Biomed Anal, 2003, 73-84. Gonzalez AG, Herrador MA, A practical guide to analytical method validation, including measurement uncertainty and accuracy profiles. Trends in Analytical Chemistry, 26, 2007, 227-238. Odumosu P, Ekwe T, Identification and Spectrophotometric determination of hydroquinone levels in some cosmetic creams, African Journal of Pharmacy and Pharmacology, 4, 2010, 231-234. 6. Pengfei Lia, Determination of telmisartan in human plasma by liquid chromatography-tandem mass spectrometry, Journal of Chromatography B, 828, 2005, 126-129. 7. Sharma S, Jogarami R, Jain P, Validated UV Spectrophotometric Method Development for Simultaneous Estimation of Tazarotene and Hydroquinone in Gel Preparation, Journal of Pharmacy Research, 5, 2012. 8. ISSN 0976 – 044X Sirajuddin, Bhanger MI, Niaz A, Shah A, Rauf A, Ultra-trace level determination of hydroquinone in waste photographic solutions by UV–vis spectrophotometry, Talanta, 72, 2007, 546-553. Source of Support: Nil, Conflict of Interest: None. Corresponding Author’s Biography: Mr. Amit Asati Mr. Amit is doing PhD from barkatullah university Bhopal. He is working on separation technique chromatography. He did post gradution (Analytical chemistry) from Samrat Ashok Technological institute (engg. College) Vidisha (M.P.) India International Journal of Pharmaceutical Sciences Review and Research Available online at www.globalresearchonline.net © Copyright protected. Unauthorised republication, reproduction, distribution, dissemination and copying of this document in whole or in part is strictly prohibited. 173
