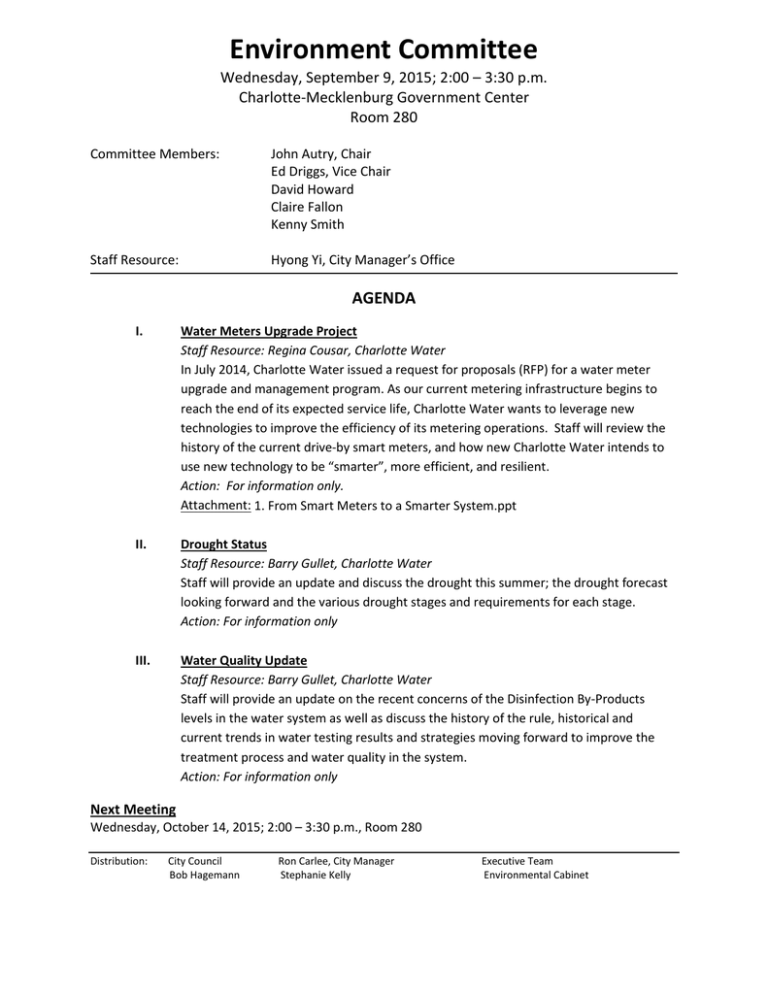
Environment Committee Wednesday, September 9, 2015; 2:00 – 3:30 p.m. Room 280
advertisement

Environment Committee Wednesday, September 9, 2015; 2:00 – 3:30 p.m. Charlotte-Mecklenburg Government Center Room 280 Committee Members: John Autry, Chair Ed Driggs, Vice Chair David Howard Claire Fallon Kenny Smith Staff Resource: Hyong Yi, City Manager’s Office AGENDA I. Water Meters Upgrade Project Staff Resource: Regina Cousar, Charlotte Water In July 2014, Charlotte Water issued a request for proposals (RFP) for a water meter upgrade and management program. As our current metering infrastructure begins to reach the end of its expected service life, Charlotte Water wants to leverage new technologies to improve the efficiency of its metering operations. Staff will review the history of the current drive-by smart meters, and how new Charlotte Water intends to use new technology to be “smarter”, more efficient, and resilient. Action: For information only. Attachment: 1. From Smart Meters to a Smarter System.ppt II. Drought Status Staff Resource: Barry Gullet, Charlotte Water Staff will provide an update and discuss the drought this summer; the drought forecast looking forward and the various drought stages and requirements for each stage. Action: For information only III. Water Quality Update Staff Resource: Barry Gullet, Charlotte Water Staff will provide an update on the recent concerns of the Disinfection By-Products levels in the water system as well as discuss the history of the rule, historical and current trends in water testing results and strategies moving forward to improve the treatment process and water quality in the system. Action: For information only Next Meeting Wednesday, October 14, 2015; 2:00 – 3:30 p.m., Room 280 Distribution: City Council Bob Hagemann Ron Carlee, City Manager Stephanie Kelly Executive Team Environmental Cabinet 9/4/2015 From Smart Meters to a Smarter System September 9, 2015 What we do at Charlotte Water Quantity FY14 Monthly Activities on Average 3 Billion Gallons of drinking water produced 2.3 Billion Gallons of wastewater treated $1.7 Million Power + Chemical cost 270,000+ Meters read 40,000 Water/sewer calls received by 311 10,350 Water services turned on/off 450 Water leaks repaired (total) 150 Water leaks repaired within 24 hours 23 Sewer spills stopped & remediated 32 Minutes Average time to respond to sewer spill 2 1 9/4/2015 How do we collect “smart” meter data currently • Monthly mobile Collection Residential with multi-family: 241,000+ Commercial with institutional: 13,000+ Irrigation: 10,000 Misc.: 4,700 • High/Low exception - review • Check read • Bill 1.Transmitter 2.Register 3.Meter 3 Why Upgrade? • 2002 to 2005 - Implemented smart drive-by; more updates to 2008 • 2009 to 2010 - Drought ends & watering allowed; High bills - Customers complained. Leads to 40 Point Improvement Plan • 2010 to 2012 – 3rd Party Meter Audit of 9000+; Resolved complaints; Stabilize drive-by and identify new technology • 2013 – Former contract ended; now replacement only contract; Meter assets reaching expected life Rate Increase 2009 Evaluation and 40 Point Plan 2010 Customer Input Meter Audit and Pilot Studies 2011 Maintenance and Improvement 2012 RFI Research 2013 RFP 2013 to Present 2 9/4/2015 Trends that are shaping future metering • Industry-wide trend: declining consumption (efficient plumbing/new habits), but the need for more service still exists • Number of customers is growing – more people in cities; denser, difficult driving areas • More customers who want discrete usage information • New systems available – more complete but more complex 5 More Bytes to Chew On Current systems are often silos; cannot talk to each other easily - single deployments such as process control at one plant We need whole system health info to optimize We need open, flexible, but secure, structures There is a great time disparity of milliseconds to years (when?) and a lack of system wide geospatial integration (where?). Customers expect us to know more We need to know more about underground assets There are few previously installed systems that use highly granular data. e.g., Systems that were designed to operate with data points per month simply are not architected to handle hourly data 3 9/4/2015 Summary of Observations – Our Reasons to Upgrade Now • Meter assets are reaching end of useful life • Trends show the need for discrete data and the skillset to apply it • Information to refine operations - exceed expectations when possible • Need “Big Data” processes and policies; pilot test in the field; institute security protocols; and refine planning for new infrastructure • Many technologies available but need to recover invested cost also – MIGRATION PATH has to fit business case Data Fusion – The Future Near Real Time Assessment of When and Where Aerial Photographs Infrastructure Data Asset Data Customer Engagement GIS Data (Location) Meter Data (Work Orders) CIS Data (Billing) SCADA (Plants) LIMS (Lab) Unifying our data structure for holistic water management • Time Synchronized • Geospatially referenced (location) Image from Graham Symmonds, Author of Smart Grid for Water 4 9/4/2015 How we research, innovate, optimize Visit suppliers, Issue RFI Pilot plant testing, research Comparison visits to other Utilities Internal – ISO certified processes External process changes Before change service map After change service map Actions we have already taken • 2010: Explored new technology – supplier visits, research • 2011: Conducted different low cost pilot tests; Visited utilities • 2012: RFI - Developed knowledge base • 2014: Developed long term strategy and issued RFP • 2015: Response review; Demo Days including Stakeholder observation; Evaluation is ongoing 5 9/4/2015 PLAN – DO – CHECK – ACT = The Strategy in our RFP Phase 1 (Years 1-3) Development of Meter Replacement Strategy stragetgic plan for ongoing replacement of meters that no longer meet accuracy requirements Assess existing business processes for operational excellence Eliminate non-value added processes Refactor business processes for efficiency Operations Center Design & Planning Phase 2 (Years 4-7) Continue strategic meter replacements based on accuracy Phase 3 (Years 7-beyond) Refactor business processes in preparation for new and enhanced systems Meter Replacement Strategy has completed one cycle within the service area and is aligned for ongoing updates Development and Implementation of Operations Center New structured processes govern the business Operations Center actively used by CMUD Processes and Technology support operational excellence and best parctices such as ISO 14001 and ISO 9000 Phased over 7 to 10 years – Optimize Business Processes, Reduce Tech Life Cycle Risks, Accommodate New Developments, Strategic Upgrades Assess implications of technology change Evaluate AMR system replacement - develop plan to migrate or improve AMR as needed to meet business objectives Develop Technology Roadmap Construct Communications Plan - Educate the organization on long-term initiatives; educate residents and stakeholders on objectives using community engagement strategies Continue AMR replacement/rehab as needed; assess potential for strategic replacement with AMI or other new technology; pilot testing of potential solutions Continue Communications Plan - internal and external communications; community engagement strategies deployed CMUD capable of Interoperability with compatible utilities AMR Next Level Replacement - Strategic deployment of AMI or other new technologyas supported by business objectives Deploy supporting systems and dependencies OPTIMIZATION – What does “smarter” mean? • Business Services Optimized for performance • Recovery of sunk costs – go to the limits of current drive-by approach • Exploring new leak detection, sampling, and pressure management technologies • Understand cost versus technical gain then strategically deploy • Engage with other utilities on potential shared path forward 12 6 9/4/2015 What Does Being “Smarter” Look Like to the Customer? HOURLY WATER USE 0.5 0.45 Irrigation – expected use 0.4 0.35 CCF 0.3 Leak – constant unexpected use 0.25 0.2 0.15 0.1 0.05 0 HOUR • • • • Daily Evidence of Possible Leak – Repair Quickly Events and Alerts on Cost and Issues Comparison with Other’s Usage Voluntary Behavior Adjustments 13 What Does Being “Smarter” Look Like to Operations? Near Real Time Pressure Management Leak Detection Capacity Analysis Pipe Failure Prediction 14 Image from Graham Symmonds, Author of Smart Grid for Water 7 9/4/2015 Building Our Future – A System of Systems based on metering • Seamless Package of New Meters, Devices, Software, and Optimization Support Services • • • • • • • • Customers with more relevant usage data Customers with Early Leak Notifications More Efficient, Secure Remote Operations Sampling Station Data Leak Detection Sensors Pressure Management Sensors Modeling and Simulation of Events Asset Condition Prediction and Notifications Staff as sensors ‐ “Crowd Sourcing” Real Time Data Barry Gullet’s Desk Actionable Intelligence Hydraulic Simulation 15 Smarter Infrastructure for a Smart City http://www2.schneider-electric.com/sites/corporate/en/solutions/sustainable_solutions/smart-cities.page Smarter example: Move Out Service Orders could be completed remotely with no truck roll similar to other utility companies; at 2500 orders per month, the cost of this single service order is nearly $1 million dollars per year 16 8 9/4/2015 Next Steps • Briefing Council Environment Committee – 9/9/15 • Narrow to Short List of Future Solution Providers • Negotiate Potential Contracts – Terms and Cost • Review with City Manager’s Office • Recommend to full Council 17 Contact information: Charlotte Water Regina Dobson Cousar 704-336-3689 18 9


