Research Journal of Applied Sciences, Engineering and Technology 5(8): 2642-2647,... ISSN: 2040-7459; e-ISSN: 2040-7467
advertisement
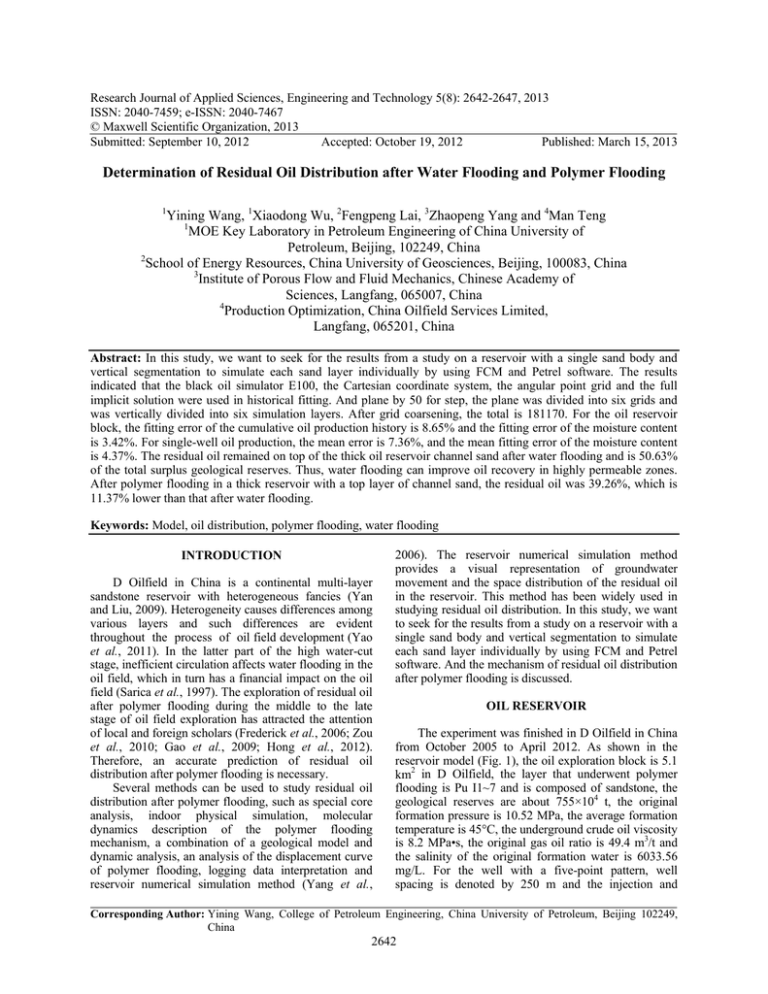
Research Journal of Applied Sciences, Engineering and Technology 5(8): 2642-2647, 2013 ISSN: 2040-7459; e-ISSN: 2040-7467 © Maxwell Scientific Organization, 2013 Submitted: September 10, 2012 Accepted: October 19, 2012 Published: March 15, 2013 Determination of Residual Oil Distribution after Water Flooding and Polymer Flooding 1 Yining Wang, 1Xiaodong Wu, 2Fengpeng Lai, 3Zhaopeng Yang and 4Man Teng 1 MOE Key Laboratory in Petroleum Engineering of China University of Petroleum, Beijing, 102249, China 2 School of Energy Resources, China University of Geosciences, Beijing, 100083, China 3 Institute of Porous Flow and Fluid Mechanics, Chinese Academy of Sciences, Langfang, 065007, China 4 Production Optimization, China Oilfield Services Limited, Langfang, 065201, China Abstract: In this study, we want to seek for the results from a study on a reservoir with a single sand body and vertical segmentation to simulate each sand layer individually by using FCM and Petrel software. The results indicated that the black oil simulator E100, the Cartesian coordinate system, the angular point grid and the full implicit solution were used in historical fitting. And plane by 50 for step, the plane was divided into six grids and was vertically divided into six simulation layers. After grid coarsening, the total is 181170. For the oil reservoir block, the fitting error of the cumulative oil production history is 8.65% and the fitting error of the moisture content is 3.42%. For single-well oil production, the mean error is 7.36%, and the mean fitting error of the moisture content is 4.37%. The residual oil remained on top of the thick oil reservoir channel sand after water flooding and is 50.63% of the total surplus geological reserves. Thus, water flooding can improve oil recovery in highly permeable zones. After polymer flooding in a thick reservoir with a top layer of channel sand, the residual oil was 39.26%, which is 11.37% lower than that after water flooding. Keywords: Model, oil distribution, polymer flooding, water flooding INTRODUCTION D Oilfield in China is a continental multi-layer sandstone reservoir with heterogeneous fancies (Yan and Liu, 2009). Heterogeneity causes differences among various layers and such differences are evident throughout the process of oil field development (Yao et al., 2011). In the latter part of the high water-cut stage, inefficient circulation affects water flooding in the oil field, which in turn has a financial impact on the oil field (Sarica et al., 1997). The exploration of residual oil after polymer flooding during the middle to the late stage of oil field exploration has attracted the attention of local and foreign scholars (Frederick et al., 2006; Zou et al., 2010; Gao et al., 2009; Hong et al., 2012). Therefore, an accurate prediction of residual oil distribution after polymer flooding is necessary. Several methods can be used to study residual oil distribution after polymer flooding, such as special core analysis, indoor physical simulation, molecular dynamics description of the polymer flooding mechanism, a combination of a geological model and dynamic analysis, an analysis of the displacement curve of polymer flooding, logging data interpretation and reservoir numerical simulation method (Yang et al., 2006). The reservoir numerical simulation method provides a visual representation of groundwater movement and the space distribution of the residual oil in the reservoir. This method has been widely used in studying residual oil distribution. In this study, we want to seek for the results from a study on a reservoir with a single sand body and vertical segmentation to simulate each sand layer individually by using FCM and Petrel software. And the mechanism of residual oil distribution after polymer flooding is discussed. OIL RESERVOIR The experiment was finished in D Oilfield in China from October 2005 to April 2012. As shown in the reservoir model (Fig. 1), the oil exploration block is 5.1 km2 in D Oilfield, the layer that underwent polymer flooding is Pu I1~7 and is composed of sandstone, the geological reserves are about 755×104 t, the original formation pressure is 10.52 MPa, the average formation temperature is 45°C, the underground crude oil viscosity is 8.2 MPa•s, the original gas oil ratio is 49.4 m3/t and the salinity of the original formation water is 6033.56 mg/L. For the well with a five-point pattern, well spacing is denoted by 250 m and the injection and Corresponding Author: Yining Wang, College of Petroleum Engineering, China University of Petroleum, Beijing 102249, China 2642 Res. J. Appl. Sci. Eng. Technol., 5(8): 2642-2647, 2013 producing wells are denoted by 45. In the block that underwent polymer injection in August 2002, the polymer injection amount is 659 PV•mg/L and the recovery degree in the oil recovery stage after polymer flooding is 19.49%. ESTABLISHMENT OF THE RESERVOIR MODEL Static data interpolation principle: The numerical simulation requires the following static parameters: sandstone roof thickness, sandstone thickness, effective thickness, permeability, porosity and saturation. The sandstone roof thickness, sandstone thickness and effective thickness can be measured by using the plane interpolation method. Sediment microfacies control permeability: Thus, when calculating permeability distribution, gradual changes in the permeability of two microfacies boundaries should be determined and used alternately with interpolation. Changes in the permeability of the two microfacies boundaries are observed during interpolation. The following principles are used to determine whether permeability has changed: At the contact line between river sand and interchannel sand, if the permeability ratio at the well point is K 1 /K 2 ≥3, then permeability has changed. If K 1 /K 2 ≤2, then permeability has increased. If 2<K 1 /K 2 <3 and h1/h 2 ≥2, then permeability has changed. If 2 <K 1 /K 2 <3 and h 1 /h 2 <2, then permeability has increased. Permeability is considered to have changed at the contact line between river sand and off-balance sheet sand. At the contact line between interchange sand and off-balance sheet sand, if h 1 /h 2 ≤2, then permeability has increased. However, if h 1 /h 2 >2, then permeability has changed. If no permeability value exists for the well point, the permeability of the outer area is 0.01 μm2 and the permeability of the thin layer is 0.04 μm2. Porosity field is calculated by using the formula for permeability. The relation is as follows: 𝜙𝜙 = 30.6748𝐾𝐾 0.0299 where, φ = The porosity K = The permeability This formula was obtained from the relative permeability data regression of two sampled core wells in Block 71. To determine the original oil saturation distribution, the water drive and residual oil saturation distribution foundation after polymer flooding need to be calculated accurately; this step was previously ignored in numerical simulations. According to Wang et al. (1996) the relationship between saturation and permeability in the original oil saturation of Pu Reservoir should be obtained to calculate the grid block of the original oil saturation in each simulation area by using: [ ] S oi = 1 − 77.8 − 16.1lg K − 3.3(lg K ) 2 100 S oi = 1 − 78.1 − 24.9 lg K + 2.0(lg K ) 2 100 S oi = 1 − 15.0 100 [ ] 1 ≤ K ≤ 50 (2) 50 ≤ K ≤ 3000 K > 3000 where, S oi = The original is oil saturation K = The permeability Geological model: By using FCM and Petrel software (Michael et al., 2008), the results from a study on a reservoir with a single sand body and vertical segmentation were used to simulate each sand layer individually. Thus, the vertical layer was divided into six simulation layers and the target layer was denoted by Pu I1~7. The plane by 20 for step and the plane were divided into 166×113 grid; a total of 166×113×61 = 1144238 grids were used. The angle point grid was determined by adjusting the distance between the grid blocks. To ensure quick, precise calculations, the oil wells were positioned in the center of the grid. The reservoir structure model is shown in Fig. 1. A geological model was established by using Petrel software and geological reserves fitting were performed. The fitted value of Pu I group is 775.57×10⁴ t and the actual value is 752.00×10⁴ t; the values have a relative error of 3.0%. (1) Fig. 1: Reservoir block structure model 2643 Res. J. Appl. Sci. Eng. Technol., 5(8): 2642-2647, 2013 (a) Fig. 3: Model stereogram Based on research on high permeability layers with low effective circulation, which mainly considered the permeability influence, four types of permeability were identified. Figure 2 shows that when the permeability ratio is 1, which indicates that the layers have similar permeabilities, the first and second layers exhibit similar slight water cut variation due to gravity. When the permeability ratio is greater than 1, the water content of the two layers differs significantly. The high permeability layer (second layer) soon attained 98% water content. Thereafter, water cut variation is more apparent at an approximate permeability ratio of 3 or 4 and the injected water collected in the second layer which has an inefficient circulation. (b) HISTORICAL FITTING (c) (d) Fig. 2: Water cut variations in each layer under different permeabilities (a) permeability ratio is 1, (b) permeability ratio is 2, (c) permeability ratio is 3, (d) permeability ratio is 4 The black oil simulator E100, the Cartesian coordinate system, the angular point grid and the full implicit solution were used in historical fitting. The oil, water, gas and dissolved gas phases were used in the whole simulation process; the oil, dissolved gas and water phases were required during the initial stage. Plane by 50 for step, the plane was divided into six grids and was vertically divided into six simulation layers. After grid coarsening, the total is 181170, as shown in Fig. 3. In production history fitting, the well with a fixed production produced the proper fluid volume and water injection. The surface area of the block fit both the overall index and the single-well index. The block fitting results are shown below (Fig. 4 and 5). For the oil reservoir block, the fitting error of the cumulative oil production history is 8.65% and the fitting error of the moisture content is 3.42%. For 2644 Res. J. Appl. Sci. Eng. Technol., 5(8): 2642-2647, 2013 Fig. 4: Cumulative oil production Fig. 5: Moisture content single-well oil production, the mean error is 7.36% and the mean fitting error of the moisture content is 4.37%. The residual oil distribution of the reservoir block after polymer flooding was calculated according to the given data. RESULTS AND DISCUSSION Differences in unit sedimentation in the residual oil after water flooding and polymer flooding: Typical sedimentation in an oil reservoir block was used as an example. The Pu I1 sedimentary unit belongs to a channel deposit with a high and a low bending strain. The channel sand is narrow, the interchange thin layer sand is unstable and the large area is a pinch out edge. After water flooding, the oil content of the river sand declined relatively. However, the residual oil in the thin channel sand is unused due to imperfect injectionproduction conditions. The residual oil is virtually useless in the west sand body characterized by a gradual pinch out. After polymer flooding, satisfactory oil production from river sand was obtained and the average residual oil saturation is 0.4. Abundant residual oil is found near the interchange and the pinch out edge. The Pu I2 sedimentary unit correlates to the channel deposit of a meandering floodplain. The channel sand body is larger, the river width reaches 1.5 km and the internal continuity is good. The average sandstone thickness is 4.52 m and the effective thickness is 3.35 m. The thickness of the sand body from the west is more significant than that from the east due to high permeability zones in the west. This difference in thickness is also due to the undeveloped thin sand layer and interchange sandstone as well as to poor continuity in the eastern area. The original oil saturation mean value is 0.75. After water flooding, the sand oil saturation declined significantly and had an 2645 Res. J. Appl. Sci. Eng. Technol., 5(8): 2642-2647, 2013 Table 1: Analysis of reservoir block structure Reservoir layer Main reservoir types 1 Thin differential layer 2 Thick reservoir top 3 River edge 4 Interwell retention type 5 Imperfect injection-production type 6 Abandoned channel barrier type Main river types High and low bending river sand body Low bending river sand body Low bending river sand body High and low bending river sand body High and low bending river sand body Low bending river sand body average of approximately 0.50. Interchange sand oil saturation declined from 0.7 to 0.6, as in B1. This difference is due to the formation of water darts upon water injection. A larger portion of the residual oil remained in the interchange sand after water flooding. During polymer flooding, oil saturation levels at different locations tended to become similar. After polymer flooding, the oil saturation in the river sand decreased significantly. Sand oil saturation of interchannel thin layer underwent low-amplitude changes. Although polymer flooding is crucial in profile control, the interchange sand body has low permeability and poor physical properties, which influenced the displacement of macromolecular polymers. Therefore, a significant amount of residual oil remained. However, upon evaluating oil saturation changes in the Pu I2 sedimentary unit, an average oil saturation of 37% was found in the main sections of the river, which is 17% lower than that during water flooding. In the thin interchange sand layer, the average oil saturation is 54%, which indicates a 9.1% drop from the saturation during water flooding and 7.8% compared with the former. Thus, residual oil saturation is low if the channel sand has a high recovery degree. If the drive mechanism of the interchange sand is poor, the residual oil saturation is high. Throughout the process, low residual oil saturation was observed in medium and high permeability oil reservoirs such as Pu I5, Pu I6 and Pu I7 after polymer flooding. Higher residual oil saturation was observed in low permeability oil reservoirs such as Pu I3 and Pu I4 and at poor polymer drive. Analysis of residual oil distribution after polymer flooding: According to the numerical simulation results, the ratio of residual oil geological reserves after water and polymer flooding is proportional, as shown in Table 1 and 2. As shown in Table 1 and 2, the residual oil remained on top of the thick oil reservoir channel sand after water flooding and is 50.63% of the total surplus geological reserves. Thus, water flooding can improve oil recovery in highly permeable zones. After polymer flooding in a thick reservoir with a top layer of channel sand, the residual oil was 39.26%, which is 11.37% lower than that after water flooding. Surplus reserves remained high due to thickness, high porosity and abundant geological reserves despite the relatively large amount of oil produced after polymer flooding. After water flooding, the residual oil ratio of Table 2: Ratio of residual oil geological polymer flooding Reservoir Ratio after layer water flooding 1 23.62 2 50.63 3 8.39 4 8.76 5 5.89 6 2.70 Main sedimentary unit Pu I1, Pu I3, Pu I4 Pu I2, Pu I5, Pu I7 Pu I2, Pu I5, Pu I6 Pu I17 Pu I17 Pu I2 reserves after water and Ratio after polymer flooding 26.98 39.26 12.73 9.54 7.85 3.63 the low permeability layer with a thin differential layer increased from 23.62 to 26.98%. This relatively higher ratio is due either to the low permeability layer or the poor effect of polymer flooding. After polymer flooding in a thick reservoir with a top layer of channel sand, the residual geological reserves were at 12.28%. Residual oil saturation was low and residual oil occupied a large proportion of the reserves, with only a small amount of the remaining recoverable reserves being available. In contrast, higher residual oil saturation and abundant remaining recoverable reserves were found at the low permeability layer that has a thin differential layer and a certain thickness. Therefore, the thickness of the low permeability layer is crucial in determining residual oil distribution after polymer flooding. CONCLUSION In this study, we want to seek for the results from a study on a reservoir with a single sand body and vertical segmentation to simulate each sand layer individually by using FCM and Petrel software. From this analysis process and experiment, we endeavor to determine of residual oil distribution after water flooding and polymer flooding in Pu I1~7. The conclusions are got from the theory analysis and calculation as following: • • 2646 The vertical layer was divided into six simulation layers and the target layer was denoted by Pu I1~7. The plane by 20 for step and the plane were divided into 166×113 grid; a total of 166×113×61 = 1144238 grids were used. The angle point grid was determined by adjusting the distance between the grid blocks. The black oil simulator E100, the Cartesian coordinate system, the angular point grid and the full implicit solution were used in historical fitting. And plane by 50 for step, the plane was divided Res. J. Appl. Sci. Eng. Technol., 5(8): 2642-2647, 2013 • • into six grids and was vertically divided into six simulation layers. After grid coarsening, the total is 181170. For the oil reservoir block, the fitting error of the cumulative oil production history is 8.65% and the fitting error of the moisture content is 3.42%. For single-well oil production, the mean error is 7.36%, and the mean fitting error of the moisture content is 4.37%. The residual oil remained on top of the thick oil reservoir channel sand after water flooding and is 50.63% of the total surplus geological reserves. Thus, water flooding can improve oil recovery in highly permeable zones. After polymer flooding in a thick reservoir with a top layer of channel sand, the residual oil was 39.26%, which is 11.37% lower than that after water flooding. ACKNOWLEDGMENT The authors gratefully acknowledge the major national science and technology projects (No. 2011ZX05009-005 and 2011ZX05056-001), 863 subjects (No. 2009AA063404) and Foundation CMG research chair in non-conventional reservoir modeling. REFERENCES Frederick, K.B., J. John, O'Neill and Raymond, M.B., 2006. Determination of the oil/water distribution coefficients of glyceryl trinitrate and two similar nitrate esters. SEP, 52(7): 637-639. Gao, J., Z.L. Wang, J.L. Wang and Y.H. Cui, 2009. Oil and water distribution during advanced water injection process in low permeability reservoir. J. Liaoning Technical Univ. Natural Sci., 28(S1): 17-20. Hong, J.S., C.G. Liu and X.F. Fu, 2012. Investigation about oil and water distribution and causes in small and fat" oil reservoir: Take beizhong oil field in beier depression hailaer basin as an example. J. Jilin Univ. Earth Sci. Edn., 42(1): 9-17. Michael, C. Sukop, H. Haibo, L.L. Chen and D.D. Milind, 2008. Distribution of multiphase fluids in porous media: Comparison between lattice boltzmann modeling and micro-x-ray tomography. Phys. Rev. E, 77(2): 710-717. Sarica, C., J.G. Flores and T.X. Chen, 1997. Investigation of holdup and pressure drop behavior for oil-water flow in vertical and deviated wells. ETCE, 32(6): 1079-1082. Wang, D.M., Z.H. Zhang and J.C. Cheng, 1996. Pilot test of alkaline surfactant polymer flooding in Daqing oilfield. SPE, 45(2): 36748-36750. Yan, C.Y. and Y. Liu, 2009. Determination of oil-water distribution model by production performance data. Petroleum Geol. Oilfield Dev. Daqing, 31(2): 135-138. Yang, C.L., C.E. Xu and X. Xu, 2006. The numerical simulation study of remaining oil distribution in multiple sandstone reservoir at high water-cut period. Offshore Oil, 26(4): 74-77. Yao, W.L., Q. Wang, J.L. Chen and T.T. Mao, 2011. Oil-water distribution and controlling factors of triassic in wellblock xia 9. J. Yangtze Univ. Natural Sci. Edn., 8(11): 16-18. Zou, Z.W., C.S. Si and M.Y. Yang, 2010. Origin and distribution of interbeds and the influence on oilwater layer: An example from Mosuowan area in the hinterland of Junggar Basin. Lithologic Reservoirs, 22(3): 66-70. 2647
