Comparison of Reference Evapotranspiratuion Estimations across Five Diverse Locations in India
advertisement
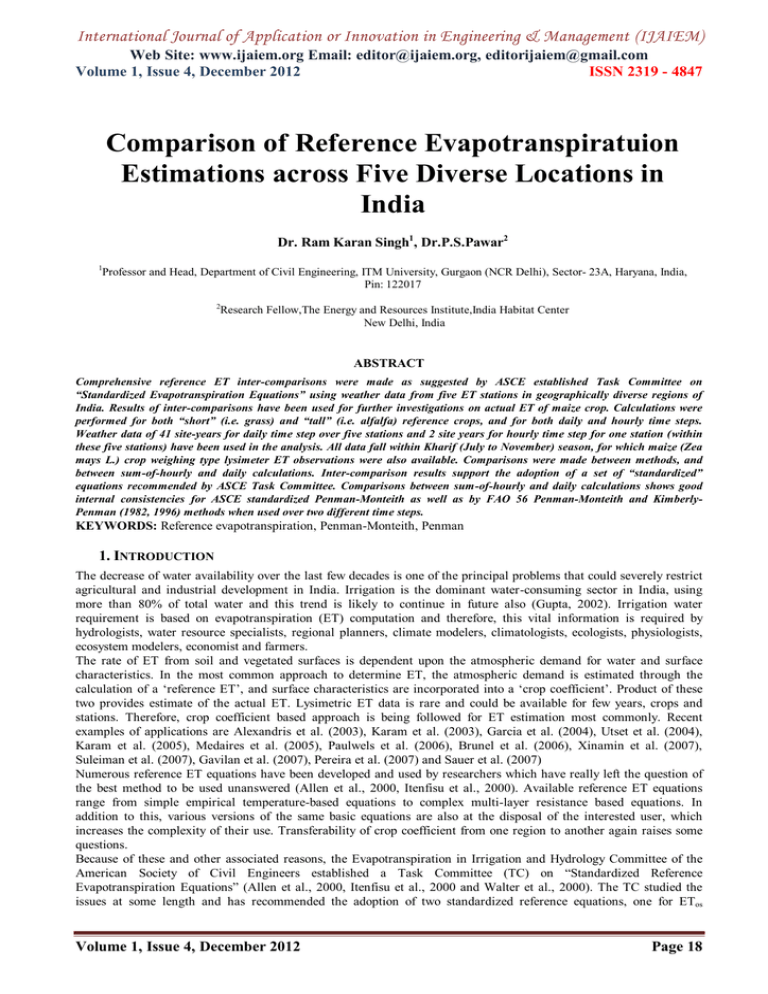
International Journal of Application or Innovation in Engineering & Management (IJAIEM) Web Site: www.ijaiem.org Email: editor@ijaiem.org, editorijaiem@gmail.com Volume 1, Issue 4, December 2012 ISSN 2319 - 4847 Comparison of Reference Evapotranspiratuion Estimations across Five Diverse Locations in India Dr. Ram Karan Singh1, Dr.P.S.Pawar2 1 Professor and Head, Department of Civil Engineering, ITM University, Gurgaon (NCR Delhi), Sector- 23A, Haryana, India, Pin: 122017 2 Research Fellow,The Energy and Resources Institute,India Habitat Center New Delhi, India ABSTRACT Comprehensive reference ET inter-comparisons were made as suggested by ASCE established Task Committee on “Standardized Evapotranspiration Equations” using weather data from five ET stations in geographically diverse regions of India. Results of inter-comparisons have been used for further investigations on actual ET of maize crop. Calculations were performed for both “short” (i.e. grass) and “tall” (i.e. alfalfa) reference crops, and for both daily and hourly time steps. Weather data of 41 site-years for daily time step over five stations and 2 site years for hourly time step for one station (within these five stations) have been used in the analysis. All data fall within Kharif (July to November) season, for which maize (Zea mays L.) crop weighing type lysimeter ET observations were also available. Comparisons were made between methods, and between sum-of-hourly and daily calculations. Inter-comparison results support the adoption of a set of “standardized” equations recommended by ASCE Task Committee. Comparisons between sum-of-hourly and daily calculations shows good internal consistencies for ASCE standardized Penman-Monteith as well as by FAO 56 Penman-Monteith and KimberlyPenman (1982, 1996) methods when used over two different time steps. KEYWORDS: Reference evapotranspiration, Penman-Monteith, Penman 1. INTRODUCTION The decrease of water availability over the last few decades is one of the principal problems that could severely restrict agricultural and industrial development in India. Irrigation is the dominant water-consuming sector in India, using more than 80% of total water and this trend is likely to continue in future also (Gupta, 2002). Irrigation water requirement is based on evapotranspiration (ET) computation and therefore, this vital information is required by hydrologists, water resource specialists, regional planners, climate modelers, climatologists, ecologists, physiologists, ecosystem modelers, economist and farmers. The rate of ET from soil and vegetated surfaces is dependent upon the atmospheric demand for water and surface characteristics. In the most common approach to determine ET, the atmospheric demand is estimated through the calculation of a ‘reference ET’, and surface characteristics are incorporated into a ‘crop coefficient’. Product of these two provides estimate of the actual ET. Lysimetric ET data is rare and could be available for few years, crops and stations. Therefore, crop coefficient based approach is being followed for ET estimation most commonly. Recent examples of applications are Alexandris et al. (2003), Karam et al. (2003), Garcia et al. (2004), Utset et al. (2004), Karam et al. (2005), Medaires et al. (2005), Paulwels et al. (2006), Brunel et al. (2006), Xinamin et al. (2007), Suleiman et al. (2007), Gavilan et al. (2007), Pereira et al. (2007) and Sauer et al. (2007) Numerous reference ET equations have been developed and used by researchers which have really left the question of the best method to be used unanswered (Allen et al., 2000, Itenfisu et al., 2000). Available reference ET equations range from simple empirical temperature-based equations to complex multi-layer resistance based equations. In addition to this, various versions of the same basic equations are also at the disposal of the interested user, which increases the complexity of their use. Transferability of crop coefficient from one region to another again raises some questions. Because of these and other associated reasons, the Evapotranspiration in Irrigation and Hydrology Committee of the American Society of Civil Engineers established a Task Committee (TC) on “Standardized Reference Evapotranspiration Equations” (Allen et al., 2000, Itenfisu et al., 2000 and Walter et al., 2000). The TC studied the issues at some length and has recommended the adoption of two standardized reference equations, one for ETos Volume 1, Issue 4, December 2012 Page 18 International Journal of Application or Innovation in Engineering & Management (IJAIEM) Web Site: www.ijaiem.org Email: editor@ijaiem.org, editorijaiem@gmail.com Volume 1, Issue 4, December 2012 ISSN 2319 - 4847 Site Year Index Site 1 to 17 New Delhi Longitude (degrees) Latitude (degrees) 28.67 77.17 Elevation (m) 228 Mean Seasonal Rain (mm) 512 Years (19-) [Total] 76 to 86, 88 to 91,05&06 [17] 18 to 22 Ludhiana 30.93 75.88 247 349 77,78,79,81,88 [5] 23 to 28 P'Nagar 29.05 79.52 241 847 77 to 82 [6] 29 to 35 R'Nagar 17.32 78.38 536 428 79 to 81, 83 to 86 [7] 36 to 41 Jhansi 25.43 78.58 251 518 90 to 94 & 96 [6] representing the short crop (i.e. grass) and one for ETrs representing a tall crop (i.e. alfalfa). Both daily and hourly versions of the equations have been presented. The purpose of the standardized equation and standardized calculation of parameters is to bring commonality to the methodology of reference ET and use it as a basis to determine crop coefficient for both agricultural and landscape use (Allen et al., 2000). The present paper describes the results of the comparisons of the reference ET equations using methodology suggested by TC and as mentioned by Itenfisu et al. (2000). Besides this, many examples are available in the literature which examines different aspects of ET viz. suitability of best ET predicting method (Karam et al., 2003, Garcia et al., 2004, Utset et al., 2004, Karam et al., 2005, Paulwels et al., 2006, Xinamin et al., 2007), verification of different component like net radiation (Brunel et al., 2006, Gavilan et al., 2007, Pereira et al., 2007, Sauer et al., 2007), crop coefficients (Medaires et al., 2005, Suleiman et al., 2007), as well as new equation development using reference ET equation (Alexandris et al., 2003, Alexandris et al., 2006). In this paper, reference ET calculations has been made using weather data from five diverse stations representing fairly wide range of weather conditions across India based on methodology suggested by TC as mentioned above. At present there is no clear standard reference ET calculation equation in India and users are selecting equations for the purpose according to available literature, skills and data. TC has recommended two forms of equations as mentioned above and recent release of FAO Irrigation and Drainage Paper No. 56 (Allen et al., 1998) has adopted the FAO 56 Penman-Monteith equation as the sole ET0 reference method. To find out the best reference ET method is the main purpose of the research. Besides this, use of ASCE PM and Kimberly Penman equation has not been reported in India which provided the idea of testing these reference ET equations in Indian context. 2. REFERENCE ET EQUATIONS As mentioned above, various reference ET equations are available. The manual of Ref-ET for Windows has given detailed description of most commonly used methods (Allen, 2000). These details can also be found in Jenson et al. (1990) and Allen et al. (1998). To avoid the duplicity of this commonly available literature, only the name of the method and its short form used in this paper has been mentioned here. For this study, 15 methods most commonly used all over world have been selected. These methods are ASCE Penman-Monteith full version (ASCE PM), ASCE Standardized Penman-Monteith (ASCE StPM), FAO 56 Penman-Monteith (FAO 56 PM), Kimberly Penman (1982 & 1996) with variable wind function (KP 96), Kimberly Penman (1972) with fixed wind function (KP 72), Penman (1948 & 1963) with original wind function (Pen 48), FAO 24 corrected Penman (FAO 24Pn), CIMIS Penman (CIMIS) for hourly time step only, FAO 24 Radiation Method (Rad), FAO 24 Blaney-Criddle Method (FAO 24BC), FAO 24 Pan Evaporation Method (PanEvap), Hargraves (1985) Method (Har 85), Priestley-Taylor (1972) Method (PT 72), Makkink (1957) Method (Mak 57), Turc (1961) Method (Turc 61). 3. METHODOLOGY Data Sources and Integrity Agricultural Meteorological Division established in 1932 is one of the important divisions of India Meteorological Department (IMD), which is responsible for high quality agricultural and weather data collection. It has a wide network of 219 agro-meteorological observatories and 40 ET observatories besides some special purpose observatories. Data used for this study was acquired from this division from five carefully selected ET observation sites. All these well maintained ET observation sites have adequate fetch and surface of green grass. The acquired data comprised all required weather parameters as well as weekly soil moisture and daily maize (Zea mays L.) crop ET observations which have been used for further investigations on the topic besides the research presented in this paper. All the data falls within the period of July to November months which are the growing period of kharif maize crop. Use of daily or larger time steps viz. weekly or monthly, for ET analysis is common in India and hourly time steps are seldom used for ET analysis. Hence, daily data of 41 site years over five ET stations and hourly data of two years from one station has been used in the analysis. Information of these five stations is summarized in the Table 1. Volume 1, Issue 4, December 2012 Page 19 International Journal of Application or Innovation in Engineering & Management (IJAIEM) Web Site: www.ijaiem.org Email: editor@ijaiem.org, editorijaiem@gmail.com Volume 1, Issue 4, December 2012 ISSN 2319 - 4847 Table 1. Summary of Weather Station Sites Used in the Study Site Year Index Site 1 to 17 New Delhi Ludhiana P'Nagar R'Nagar Jhansi 18 to 22 23 to 28 29 to 35 36 to 41 Longitude (degrees) Latitude (degrees) Elevation (m) 28.67 77.17 228 Mean Seasonal Rain (mm) 512 30.93 29.05 17.32 25.43 75.88 79.52 78.38 78.58 247 241 536 251 349 847 428 518 Years (19-) [Total] 76 to 86, 88 to 91,05&06 [17] 77,78,79,81,88 [5] 77 to 82 [6] 79 to 81, 83 to 86 [7] 90 to 94 & 96 [6] Geographic and climatic diversity of these five sites is evident and site elevations range from 228 m to 536 m above msl with growing season precipitation ranging from 350 mm to 850 mm. For the stations and years analyzed, the mean ASCE PM ETo within growing period varied from 1.44 mm.d-1 to 9.72 mm.d-1. Attention was paid to quality assurance and integrity assessment criteria of the weather data sets. Measured radiation has been compared to theoretical solar radiation during clear sky period. It is observed that coefficient of determination (R2) between measured net radiation and FAO 56 method calculated net radiation is 90.7%. Comparison of daily average dew point temperature with daily minimum air temperature as mentioned by Allen (1996) indicated that most of the data is good with very rare periods of two to four days having subtraction of dew point temperature from minimum temperature (Tdew – Tmin < 0) less than zero. To get the real results of the comparisons, corrected data for such periods has been ignored from the analysis. Assessment of homogeneity of data sets over one station for which maximum number of site year data is available and observations of nearby weather station are also available, has been done using double mass technique following the protocol given in FAO 56. Reference ET Calculations Grass and alfalfa reference ET for daily and hourly time steps were calculated using “REF-ET for Windows” (Reference Evapotranspiration Calculator) Version 2.0. This is a software program (Allen, 2000) specifically written to perform standardized reference ET calculations for variety of commonly used equations. Analyzing all weather data files through this program facilitates consistency in calculations and units. To get reference ET calculation results for each site year, two runs of REF-ET program required for two different time steps. In one run program gives results for short reference crop (ETos) and tall reference crop (ETrs) equations. The fifteen methods used in the analysis have been developed for specific reference surfaces viz. some methods calculate grass reference ET, some methods calculate alfalfa reference ET and some methods can calculate reference ET for both surfaces. Reference ET for one surface can be converted to other reference surface using particular ETos/ETrs ratio. But in this analysis results of the converted reference ET have not been used. Carefully reviewed data files using methods mentioned above were converted to text files first and then using definition file of each site, output file results for one site year was taken. Input file, definition file, intermediate files and output files were checked carefully and calculation for the remaining site years performed. Result files of all hourly and daily reference ET calculation were brought together and analyzed. Hourly ET outputs were summed firstly to provide the 24-hour sum for each day. Simple statistics were calculated to describe both sum-of-hourly and daily outputs for each station, site-year and ET equations. These summary statistics included the maximum, minimum, mean and standard deviation. Summary statistics worked out separately for each of the ETos and ETrs equations. Root mean square difference (RMSD) was calculated for the purpose of comparing one reference method to another, or for comparing sum-of-hourly to daily values as mentioned by Itenfisu et al. (2000). The analysis of the reference ET calculations was carried out in many different ways as suggested by TC and mentioned by Itenfisu et al. (2000). Calculations for several methods, ETos and ETrs references and the option of daily and hourly time steps, was paid due attention. Analysis and results presented in this research paper can be conveniently divided into the following three sections: 1) For each method, comparisons were done between the sum-of-hourly reference ET values and the daily values calculated using same method. This comparison provided measure of methods internal consistency when used for two different time steps. 2) The TC has chosen ASCE PM as a benchmark for comparisons as it is a well recognized equation which has shown to accurately track ET measurements made under reference conditions at most locations. Comparisons have also been carried out between daily reference ET values and the daily values calculated using ASCE PM Method for each method in this study. Volume 1, Issue 4, December 2012 Page 20 International Journal of Application or Innovation in Engineering & Management (IJAIEM) Web Site: www.ijaiem.org Email: editor@ijaiem.org, editorijaiem@gmail.com Volume 1, Issue 4, December 2012 ISSN 2319 - 4847 3) Comparisons are also provided between the sum-of- hourly reference ET values and daily values calculated using the ASCE PM Method. This comparison is essentially a combination of the first two sections. 4. RESULTS AND DISCUSSION The analysis of reference ET calculations for two reference surfaces viz. ETos & ETrs, for two different time steps viz. hourly and daily, for each station and site-year as mentioned in the methodology section has been summarized in the Tables 2 to 5. Since TC had recommended ASCE Standardized Equation (ETos & ETrs) for use and testing over different locations, therefore particular emphasis has been given to performance of ASCE stPM but results for all of the key reference ET equations have been included. Sum-of-Hourly vs. Daily (Within Method) The first step was to examine whether the sum of hourly reference ET for a given method compared satisfactorily with the daily calculation by the same method. For each day at each site, the 24 hourly ET values were summed, and then seasonal mean of those sums were determined. Then, the ratios of the seasonal mean sum-of-hourly ET to the seasonal mean daily ET were computed. The RMSD for the growing season was calculated as the root-mean-square difference between the sum-of-hourly values and their corresponding daily values. Table 2 shows statistical summaries of ratios and RMSDs. For example for interpreting the table, ratio of comparing sum-of-hourly ASCE PM ETos to daily ETos for all data has a maximum of 1.290, minimum of 0.723, mean of 1.052, and standard deviation of 0.099. This implies that when averaged over growing season for all the hourly data site-years studied, the sum-of-hourly ET values were as much as 29% higher within any site-year studied and 27.7% lower within same or another site-year studied, with average being about 5.2% higher. The mean RMSD between sum-of-hourly ASCE PM ETos and daily ASCE PM ETos was 0.220 mm.d-1, with a maximum of 0.585 mm.d-1, and minimum of 0.010 mm.d-1. The final column of the Table 2 represents normalized RMSD based on the magnitude of ET. Mean RMSD was 7.951% of the mean daily ET for ASCE PM ETos. Table 2. Statistical Summary of the Comparisons of sum-of-hourly Vs daily ET (within method) Method Ratio Max Min Mea Std Dev MAX n Sum-of-Hourly ETos Vs Daily ETos (within method) ASCE PM 1.29 0.72 1.052 0.099 0.585 0 3 ASCE 1.27 0.73 1.047 0.097 0.575 stPM 5 3 FAO 56PM 1.23 0.69 1.006 0.096 0.590 1 7 KP 96 1.23 0.55 1.006 0.098 0.765 1 7 Pen 63 1.21 0.75 1.054 0.075 0.740 6 9 Sum-of-Hourly ETrs Vs Daily ETrs (within method) ASCE PM 1.28 0.67 1.034 0.101 0.830 0 6 ASCE 1.27 0.71 1.030 0.098 0.805 stPM 9 9 KP 96 1.16 0.56 0.987 0.096 0.750 3 9 KP 72 1.10 0.51 0.950 0.094 0.900 7 3 Volume 1, Issue 4, December 2012 RMSD (mm.d-1) RMSD as % of Mean Daily ET MIN MEAN Std Dev 0.01 0 0.00 0 0.00 0 0.00 5 0.00 5 0.220 0.139 7.951 0.210 0.134 7.628 0.193 0.152 6.923 0.177 0.158 6.424 0.273 0.167 8.675 0.00 0 0.00 0 0.00 0 0.00 0 0.261 0.198 6.956 0.241 0.191 6.623 0.196 0.170 5.947 0.240 0.169 6.762 Page 21 International Journal of Application or Innovation in Engineering & Management (IJAIEM) Web Site: www.ijaiem.org Email: editor@ijaiem.org, editorijaiem@gmail.com Volume 1, Issue 4, December 2012 ISSN 2319 - 4847 Based on mean ratios and standard deviations, and the mean RMSD and standard deviations, KP 96 (ET os) showed the best agreement between sum-of-hourly ETos and daily values of ETos (Table No 2). Mean ratio, mean RMSD and percentage of mean RMSD to daily ETos were 1.006, 0.177 mm.d-1 and 6.424%, respectively, for this method. FAO 56 PM and ASCE stPM methods are also in a very close agreement with this method. Mean ratio, mean RMSD and percentage of mean RMSD to daily ETos were 1.006, 0.193 mm.d-1 and 6.923% for FAO 56 PM ETos and 1.047, 0.210 mm.d-1 and 7.628% for ASCE stPM ETos method, respectively. As shown by mean RMSD ETos values, sum-of-hourly is about 0.177, 0.193, and 0.210 mm.d-1 higher than daily ETos for KP 96, FAO 56 PM, and ASCE stPM methods, respectively. Root-mean-square difference between these three methods was 0.033 mm.d-1 (difference between 0.210 & 0.177), which is almost insignificant, hence it can be said that these three methods are having very well internal consistency when used over two different time steps. With regard to ETrs, there was reasonably good hourly to daily agreement for both the ASCE stPM (3% over prediction) and KP 96 (1.3% under prediction). The ASCE PM method also showed good results with 3.4% over prediction. 5. DAILY CALCULATED VS. DAILY ASCE PM Table 3 summarizes comparisons between methods daily reference ET and the daily ET calculated with ASCE PM equation. As evident from Table 3 mean ratio column, ASCE stPM and FAO 56 PM calculated ETos values are very close to ASCE PM values (4% under prediction for both the methods). As the former two methods are direct derivative of the latter method, this result was expected. The other three methods viz. KP 96, Pen 63, and FAO 24Pn are over predicting by 10.4%, 11.3% & 14.4%, respectively compared to the ASCE PM ETos. Table 3. Statistical Summary of the Comparisons of daily method Vs daily ASCE PM ET Method RMSD (mm.d-1) Ratio Max Min Mea Std Dev n Daily Method ETos Vs Daily ASCE PM ETos ASCE 1.00 0.99 0.996 0.002 stPM 0 2 FAO 56PM 1.00 0.99 0.996 0.002 0 2 KP 96 1.28 0.96 1.104 0.063 9 2 Pen 63 1.33 0.98 1.113 0.057 1 3 FAO 24Pn 1.34 0.83 1.144 0.103 7 0 Daily Method ETrs Vs Daily ASCE PM ETrs ASCE 1.00 0.97 0.986 0.006 stPM 3 2 KP 96 1.20 0.86 1.021 0.061 3 5 KP 72 1.25 0.90 1.043 0.060 4 9 RMSD as % of Mean Daily ET MAX MIN MEAN Std Dev 0.042 0.00 1 0.00 1 0.01 7 0.07 9 0.02 7 0.016 0.010 0.382 0.016 0.010 0.382 0.490 0.355 10.031 0.548 0.276 17.578 0.823 0.585 27.611 0.00 3 0.00 4 0.00 4 0.078 0.046 1.526 0.289 0.264 5.450 0.297 0.258 5.534 0.042 1.644 1.403 2.616 0.232 1.331 1.251 In relation to ETrs, ASCE stPM showed best results, with mean ratio (1.4% under prediction), mean RMSD (0.078 mm.d-1 which is 0.382% of daily ETrs) as compared to ASCE PM ETrs. Mean ratio of the other two methods, viz. KP 96 and KP 72 to ASCE PM ETrs were 2.1% & 4.3% higher, respectively, and mean RMSD for same two methods was 0.289 mm.d-1 (5.450% of daily ETrs) and 0.297 mm.d-1 (5.534% of daily ETrs), respectively. In this case also, ASCE stPM showed best agreement as compared to KP 96 and KP 72 with ASCE PM ETrs values as the former method is a simplified version of the latter. Availability of full set of data required for use of combination equations over many sites in India is lacking. Hence, temperature or radiation based equations which calculate ET using fewer weather parameters is of practical relevance. Volume 1, Issue 4, December 2012 Page 22 International Journal of Application or Innovation in Engineering & Management (IJAIEM) Web Site: www.ijaiem.org Email: editor@ijaiem.org, editorijaiem@gmail.com Volume 1, Issue 4, December 2012 ISSN 2319 - 4847 Results of the comparison of daily ETos calculated using temperature or radiation methods with ASCE PM method calculated daily ETos is shown in Table 4. Table 4. Statistical Summary of the Comparisons between various radiation or temperature based methods Method FAO 24BC 1961 Turc Prs- Tylr FAO 24Rd 1985 Harg 1957 Makk FAO Pan RMSD (mm.d-1) Ratio Max Min 1.39 9 1.39 4 1.40 2 1.46 5 1.97 4 1.04 4 2.23 7 0.72 3 0.65 6 0.68 8 0.70 0 0.68 7 0.50 5 0.27 2 RMSD as % of Mean Daily ET Mea n 1.014 Std Dev MAX MIN MEAN Std Dev 0.140 1.694 0.499 0.416 12.108 0.991 0.135 2.651 0.500 0.506 13.463 1.068 0.138 2.070 0.622 0.437 14.635 1.075 0.170 1.988 0.696 0.485 15.370 1.153 0.263 2.649 0.840 0.614 19.321 0.802 0.115 2.784 0.892 0.584 27.432 0.925 0.310 4.137 0.00 7 0.00 8 0.03 2 0.01 1 0.02 1 0.08 0 0.02 0 1.026 0.809 27.436 Reasonably good daily predictions were shown by FAO 24BC and Turc 61 method calculated ETos values with ASCE PM calculated values. Mean ratio of FAO 24BC method to ASCE PM was 1.4% higher and mean RMSD was 12.108% higher than mean daily ETos while mean ratio of Turc 61 method to ASCE PM was 0.9% lower and mean RMSD was 13.463% lower than mean daily ETos. Priestley-Taylor (1972) and FAO 24 Radiation method predicted daily ETos values were 6.8% higher and 7.5% higher than ASCE PM calculated ETos values. Mean RMSD was 14.635% higher for PT 72 and 15.370% higher for FAO 24 Radiation method than the mean daily ETos values. Temperature based Hargreaves (1985) method showed variability of about 15.3% over predictions while the other methods viz. Makkink (1957) and FAO 24 Pan Evaporation showed even greater variability’s as compared to ASCE PM. Daily predictions are also shown graphically in Figures 1 and 2. Combinations of 41 site-years are plotted along horizontal axis for which Table 1 helps in understanding site-year index for various stations. Figure 1(a) shows ratios of the mean daily output of the various ETos equations to the mean daily ASCE PM ETos. Mean ratios presented in Table 2 has been calculated using these values. The similarity of the ASCE stPM and FAO 56 PM results to each other, and to the ASCE PM results, is evident and it is obvious as these two methods has common equation basis. For the stations and site-years under study, KP 96 method is predicting consistently, slightly less than or around 1.1 while Penman (1948, 1963) method is predicting around 1.1 and slightly higher than 1.1. Mean ratio of daily FAO 24 Penman method ETos to that of ASCE PM ETos is in the range of 1.15 to 1.25. For ETrs, ratios shown in Figure 1(b), indicates that ASCE stPM and ASCE PM methods are in a close agreement with each other at all sites, also due to their common basis. Mean ratios of daily ASCE stPM to daily ASCE PM are about 0.98 to 0.99 meaning 1% to 2% under prediction by ASCE stPM. These results support what has been essentially reported earlier by Walter et al. (2000) and Itenfisu et al. (2000). From Figure 1 and Table 3 along with reports of Walter et al. (2000) and Itenfisu et al. (2000), it can be inferred that “simplification made to standardized form of the equation did not bias prediction accuracy from station to station”. Mean ratios for the other methods, KP 96 and KP 72 to ASCE PM daily ETrs are in the range of 1.0 to 1.15. Figure 2(a) shows that KP 96, Penman (1963) and FAO 24P are consistently over predicting than the ASCE PM ETos for all range of magnitudes of ETos. Consistent trend of over prediction can be observed for KP 96 and Penman (1963) ETos values over the complete range of ASCE PM ETos values. Two derivatives of the ASCE PM i.e. ASCE stPM and FAO 56 PM, tracked ASCE PM very closely throughout the domain. Figure 2(b) shows that KP 96 and KP 72 estimates of ETrs are slightly greater than ASCE PM ETrs predictions up to 5.5 mm.d-1 and they are coming to very close to or slightly less than ASCE PM ETrs for higher magnitudes. Volume 1, Issue 4, December 2012 Page 23 International Journal of Application or Innovation in Engineering & Management (IJAIEM) Web Site: www.ijaiem.org Email: editor@ijaiem.org, editorijaiem@gmail.com Volume 1, Issue 4, December 2012 ISSN 2319 - 4847 1.4 1.2 ETo) R atio(M ethodETo:A SC EPM (a) 1.3 1.1 1 ASCE stPM FAO 56 PM KP 96 Pen 63 FAO 24P 0.9 0.8 0.7 0 3 6 9 12 15 18 21 24 27 30 33 36 39 42 Site-Year Index 1.2 R atio(M ethodETr:A SC EPM (b) ASCE stPM KP 96 KP 72 ETr) 1.1 1 0.9 0.8 0 3 6 9 12 15 18 21 24 27 30 33 36 39 42 Site -Ye a r Inde x Figure 1. Ratio of the daily reference ET for a particular method to the daily reference ET for the ASCE PM equation. ETos is plotted in (a) and ETrs is plotted in (b). Ratios are an average over the growing season. Refer to Table 1 to match the site-year index. 7 M ethodETo(m m /d) (a) 6 5 □ ASCE stPM FAO 56 PM Δ KP 96 × Pen 63 ○ FAO 24 P 4 (R2=0.998) (R2=0.998) 2 (R =0.960) 2 (R =0.576) (R2=0.384) 3 3 4 5 6 7 ASCE PM ETo (mm/d) 8 (b) M ethodETr (mm/d) 7 6 □ ASCE stPM (R2=0.998) 5 ○ KP 96 (R2=0.952) 4 Δ KP 72 (R =0.954) 2 3 3 4 5 6 ASCE PM ETr (mm/d) 7 8 Figure 2. Growing season mean daily reference ET for a particular method vs. growing season mean daily reference ET for the ASCE PM equation. ETos is plotted in (a) and ETrs is plotted in (b). 41 site-years data are Volume 1, Issue 4, December 2012 Page 24 International Journal of Application or Innovation in Engineering & Management (IJAIEM) Web Site: www.ijaiem.org Email: editor@ijaiem.org, editorijaiem@gmail.com Volume 1, Issue 4, December 2012 ISSN 2319 - 4847 included. Sum-of-Hourly vs. Daily ASCE PM The third type of comparison was made between sum-of-hourly calculation by a particular method and the daily calculation by the ASCE PM equation. Results show that the sum-of-hourly predictions by the ASCE stPM actually agree more closely with daily ASCE PM than do the sum-of-hourly values from the ASCE PM (Table 5). Table 5. Statistical Summary of the Comparisons of daily ASCE PM ET Vs method sum-of-hourly Method RMSD (mm.d-1) Ratio Max Min Mean Std Dev Daily ASCE PM ETos Vs Method Sum-of-Hourly ETos ASCE PM 1.290 0.723 1.052 0.099 ASCE stPM 1.284 0.735 1.047 0.097 FAO 56PM 1.236 0.699 1.006 0.096 CIMIS 1.335 0.720 1.079 0.109 KP 96 1.205 0.665 0.996 0.114 Pen 48 1.656 0.881 1.243 0.146 Daily ASCE PM ETrs Vs Method Sum-of-Hourly ETrs ASCE PM 1.280 0.676 1.034 0.101 ASCE stPM 1.257 0.709 1.006 0.097 KP 96 1.205 0.579 0.892 0.124 KP72 1.289 0.625 0.996 0.119 MAX MIN RMSD as % of Mean Daily ET MEAN Std Dev 0.585 0.575 0.615 0.975 0.940 1.380 0.010 0.010 0.000 0.000 0.005 0.010 0.220 0.214 0.199 0.267 0.248 0.575 0.139 0.135 0.155 0.185 0.186 0.276 7.951 7.754 7.091 9.072 9.282 17.901 0.830 0.955 2.135 1.305 0.000 0.000 0.005 0.015 0.261 0.232 0.489 0.313 0.198 0.209 0.443 0.260 6.956 6.362 16.653 8.848 This is true for both ETos and ETrs and is due to the lower values for daytime surface resistance used for daytime hourly periods. The CIMIS Penman ETos equation, which is only applied hourly, gave sum-of-hourly values that averaged about 7.9% higher than daily ASCE PM calculations, with a maximum ratio of 1.335 and a minimum of 0.720. Higher CIMIS Penman predictions can be explained because soil heat flux is neglected in this equation while other Penman versions had soil heat flux considerations for hourly time step estimates. Slightly better predictions than the ASCE stPM predicted ETos values was also observed for FAO 56 PM and KP 96 method predicted ETos values. Mean RMSD’s between ASCE PM method ETos and these three methods ranges between 0.199 to 0.248 mm.d-1, which is very less magnitude of ETos. Mean RMSD of ASCE stPM has less standard deviation as compared to other two methods, which indicates that one can depend reliably on ASCE stPM equation for ET predictions. 6. CONCLUSIONS Comprehensive reference ET inter-comparisons were made as suggested by ASCE established Task Committee on “Standardized Evapotranspiration Equations” using weather data from five ET stations in geographically diverse regions of India. From these inter-comparisons it was concluded that methodology suggested by TC and tool (Ref-ET program) are very useful for such studies. TC mainly insists the widespread evaluation and performance testing of popular reference ET equations against validated field measurements over a wide range of locations as well as use of ASCE stPM & Kimberly Penman methods. This paper addresses this particular aspect for Indian conditions and results obtained are representative of semi-arid and tropical countries. From inter-comparisons quantified by study of ratios and root mean square difference of 41 site-years daily data and 2 site-years hourly data, it can be concluded that there was good agreement between daily time-step and hourly time-step results for ASCE standardized equations (ETos & ETrs) and this method very closely tracked ASCE PM. These research results provide important information on performance of ET equations and will be used for further investigations on maize crop actual evapotranspiration. REFERENCES [1.] Alexandris, S., Kerkides, P., 2003. New empirical formula for hourly estimates of reference evapotranspiration. Agric. Water Manage. 60, 181-198. Volume 1, Issue 4, December 2012 Page 25 International Journal of Application or Innovation in Engineering & Management (IJAIEM) Web Site: www.ijaiem.org Email: editor@ijaiem.org, editorijaiem@gmail.com Volume 1, Issue 4, December 2012 ISSN 2319 - 4847 [2.] Alexandris, S., Kerkides, P., Liakatas, A., 2006. Daily reference evapotrnspiration estimates by the “Copais” approach, Agric. Water Manage. 82, 371-386. [3.] Allen, R. G., 1996. Assessing integrity of weather data for use in reference evapotranspiration estimation. J Irrig. Drain. Eng. 122(2), 97-106. [4.] Allen, R. G., Pereira L. S., Raes D., Smith M., 1998. Crop evapotranspiration: guidelines for computing crop water requirements. Irrigation and Drainage Engineering Paper No 56, United Nations Food and Agriculture Organization, Rome, Italy. [5.] Allen, R. G., 2000. REF-ET for Windows: reference evapotranspiration calculator version 2.0, University of Idaho Research and Extension Center, Kimberly, ID. Current online version: http://www.kimberly.uidaho.edu/refet/ [6.] Allen R. G., Walter, I. A., Elliott, R., Mecham, B., Jensen, M. E., Itenfisu, D., Howell, T. A., Snyder, R., Brown, P., Echings, S., Spofford, T., Hattendorf, M., Cuenca, R. H., Wright, J. L., Martin, D., 2000. Issues, requirements and challenges in selecting and specifying a standard ET equation. In: Evans, R. G., Benham, B. L., Trooien, T. P. (Eds), Proceedings of the 4th Decennial Irrigation Symposium (ASAE), 14-16 November 2000, at Phoenix, AZ., U.S.A., 201-208. [7.]Brunel, J., Ihab, J., Droubi, A. M., Samaan, S., 2006. Energy budget and actual evapotranspiration of an arid oasis ecosystem: Palmyra (Syria). Agric. Water Manage. 84, 213-220. [8.] Dorrenbos, J., Pruitt, W. O., 1977. Crop Water Requirements. Irrigation and Drainage Engineering Paper No 24, United Nations Food and Agriculture Organization, Rome, Italy. [9.] Garcia, M., Raes, D., Allen, R., Herbas, C., 2004. Dynamics of evapotranspiration in Bolivian highlands (Altipano). Agric. Forest Meteorol. 25 (1-2), 67-82. [10.] Gavilan, P., Berengena, J., Allen, R. G., 2007. Measuring versus estimating net radiation and soil heat flux: Impact on Penman-Monteith reference ET estimates in semiarid regions. Agric. Water Manage. 89, 275-286. [11.] Gupta, S. P., 2002, India Vision 2020. Online document of Planning Commission, Govt. of India, (http://planningcommission.nic.in/plans/planrel/pl_vsn2020.pdf) [12.]Hargreaves, G. L. and Z. A. Samani. 1985. Reference crop evapotranspiration from temperature. Appl. Eng. Agric. 1(2): 96—99. [13.] Itenfisu, D., Elliott, R., Allen, R. G., Walter, I. A., 2000. Comparison of reference evapotranspiration calculation across range of climates. In: Evans, R. G., Benham, B. L., Trooien, T. P. (Eds), Proceedings of the 4th Decennial Irrigation Symposium (ASAE), 14-16 November 2000, at Phoenix, AZ., U.S.A., 216-227. [14.] Jenson, M. E., Burman, R. D., Allen, R. G., 1990. Evapotranspiration and irrigation water requirements. ASCE Manuals and Reports on Engineering Practice No. 70, ASCE, New York, NY, U.S.A., pp332. [15.] Karam, F., Breidy, J., Stephan, C., Rouphael, J., 2003. Evapotranspiration, yield and water use efficiency of drip irrigated corn in the Bekka Valley, Lebanon. Agric. Water Manage. 63, 125-137. [16.] Karam, F., Masaad, R., Steir, T., Mounzer, O., Rouphael, Y., 2005. Evapotranspiration and seed yield of field grown soyabean under deficit irrigation conditions. Agric. Water Manage. 75, 226-244. [17.] Medaires, G. A., Arruda, F. B., Sakai, E., 2005. Crop coefficients for irrigated beans derived using three reference evapotranspiratin methods. Agric. Forest Meteorol. 135 (1-4), 135-143. [18.] Pauwels, V. R. N., Samson, R., 2006. Comparison of different methods to measure and model actual evapotranspiration rates for a wet sloping grasslands. Agric. Water Manage. 82, 1-24. [19.] Pereira, A. R., Green, S. R., Nova, N. A. V., 2007. Sap flow, leaf area, net radiation and Priestlay-Taylor formula for irrigated orchard and isolated trees. Agric. Water Manage. 92, 48-52. [20.] Sauer, T. J., Singer, J. W., Prueger, J. H., DeSutter, T. M., Hatfield, J. L., 2007. Radiation balance and evaporation partitioning in a narrow-row soyabean canopy. Agric. Forest Meteorol. 145 (3-4), 206-214. [21.] Suleiman, A. A., Soler, C. M. T., Hoogenboom, G., 2007. Evaluation of FAO-56 crop coefficient procedures for deficit irrigation management of cotton in a humid climate. Agric. Water Manage. 91, 33-42. [22.] Utset, A., Farre, I., Martinez-Cob, A., Cavero, J., 2004. Comparing Penman-Monteith and Priestley-Taylor approaches as reference-evapotranspiration inputs for modeling maize water-use under Mediterranean conditions. Agric. Water Manage. 66, 205-219. [23.] Walter, I. A., Allen, R. G., Elliott, R., Mecham, B., Jensen, M. E., Itenfisu, D., Howell, T. A., Snyder, R., Brown, P., Echings, S., Spofford, T., Hattendorf, M., Cuenca, R. H., Wright, J. L., Martin, D., 2000. ASCE’s standardized reference evapotranspiration equation. In: Evans, R. G., Benham, B. L., Trooien, T. P. (Eds), Proceedings of the 4th Decennial Irrigation Symposium (ASAE), 14-16 November 2000, at Phoenix, AZ., U.S.A., 209-215. [24.] Xinmin, Z., Lin, H., Xiuju, B., Bingxiang, Z., Fahe, C., Xinzhang, S., 2007. The most economical irrigation amount and evapotranspiration of the turfgrasses in Beijing City, China. Agric. Water Manage. 89, 98-104. Volume 1, Issue 4, December 2012 Page 26 International Journal of Application or Innovation in Engineering & Management (IJAIEM) Web Site: www.ijaiem.org Email: editor@ijaiem.org, editorijaiem@gmail.com Volume 1, Issue 4, December 2012 ISSN 2319 - 4847 ABOUT AUTHOR Dr. Ram Karan Singh An acknowledged researcher, renowned academician and academic administrator, Dr Ram Karan Singh is presently Professor and Head of Civil Engineering Department at ITM University, Gurgaon has over 22 years of teaching, research, administrative, and consultancy experience in top institutions/universities in India (14 years) and abroad (7years). He has done degrees, B.E. (Hons.) Civil Engineering with M.Sc. (Hons.) Chemistry, M.Tech. in Civil Engineering (with specialization in Hydraulics Engineering) and Ph.D. in the area of Hydraulics & Water Resources Engineering from a premier institute, BITS- Pilani, Pilani India. Awarded by JSPS (Japan Society for the Promotion of Science) Post-Doctoral Fellowship, Japanese Govt. (letter no. JSPS/FF1/185; ID No. P 02413) for a period of 2 years from 2002-2004 to carry out “Diffuse pollution modeling of water environment of Japanese low land watersheds”, in Japan at Department of Hydraulics Engineering, NIRE, Tsukuba Science City, Japan, 305-8609, JAPAN. He has visited all major continents on research, teaching and collaborative assignments some important one are Keimyung University, South Korea (December 2011), University of Michigan, Ann Arbor, U.S.A.(May,2011); Michigan Technological University, Houghton ,U.S.A.(May,2011); NIRE, Tsukuba Science City, Japan(July,2002July,2004); Dublin University, Ireland (September 2003); Omar Mukhtar University, Libya (Ministry of Higher Education)(October,2008-July,2009); and Arbaminch Water Technology University,(UNDP Funded)(October,1998July,2002).He has completed the research projects funded by USIEF, USA, GTZ, Germany; JSPS, Japan; DAAD, Germany; UNESCO, New Delhi; SNV, Netherland; DST, India; and AICTE, India as a project principal investigator. Volume 1, Issue 4, December 2012 Page 27
