Thinking and Feeling Interact to Influence Behavior and Mental Health
advertisement
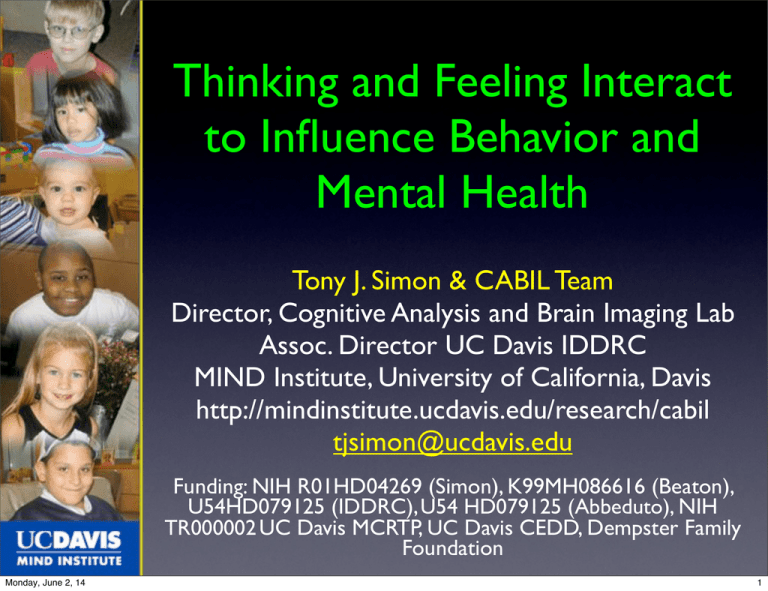
Thinking and Feeling Interact to Influence Behavior and Mental Health Tony J. Simon & CABIL Team Director, Cognitive Analysis and Brain Imaging Lab Assoc. Director UC Davis IDDRC MIND Institute, University of California, Davis http://mindinstitute.ucdavis.edu/research/cabil tjsimon@ucdavis.edu Funding: NIH R01HD04269 (Simon), K99MH086616 (Beaton), U54HD079125 (IDDRC), U54 HD079125 (Abbeduto), NIH TR000002 UC Davis MCRTP, UC Davis CEDD, Dempster Family Foundation Monday, June 2, 14 1 Core Working Hypothesis Cognitive impairments limit competence in numerous domains but vary widely among children and across ages Despite cognitive limitations some children outperform predictions from testing while others fall very short “copers” show lower anxiety, higher real world functioning and often achieve in academics far beyond what cognitive testing would predict “strugglers” show the reverse pattern - more anxiety poorer adaptive functioning and worse academics 2 Monday, June 2, 14 2 Core Working Hypothesis Cognitive impairments limit competence in numerous domains but vary widely among children and across ages Despite cognitive limitations some children outperform predictions from testing while others fall very short “copers” show lower anxiety, higher real world functioning and often achieve in academics far beyond what cognitive testing would predict “strugglers” show the reverse pattern - more anxiety poorer adaptive functioning and worse academics strugglers might experience more stress & higher psychiatric risk If so, we can help target cognitive, emotional and environmental factors for intervention to improve academics, mental health, family dynamics 2 Monday, June 2, 14 2 Stimulation Monday, June 2, 14 3 Anxiety Not IQ Predicts Adaptive Function 22q: N=99; r=-0.04; p=0.71 TD: N=45; r=0.5; p=0.002 Unlike TD children, FSIQ is NOT related to adaptive function in children with 22q11.2DS aged 7-14 years Monday, June 2, 14 4 Anxiety Not IQ Predicts Adaptive Function Monday, June 2, 14 4 Anxiety Not IQ Predicts Adaptive Function 22q11.2, N=62; r=-0.34, p=0.007 Copers Strugglers In children with 22q11.2DS aged 7-14 years, adaptive function is strongly and negatively related to anxiety levels Monday, June 2, 14 4 “Hot Cognition: Attention” New tasks manipulate emotional content with different faces to see effect on functioning. Dot Probe Threat Bias is affective attention task anxious children orient attention to “threat”, losing some control 5 Monday, June 2, 14 5 “Hot Cognition: Attention” New tasks manipulate emotional content with different faces to see effect on functioning. Dot Probe Threat Bias is affective attention task anxious children orient attention to “threat”, losing some control 500ms 500ms 2500ms 5 Monday, June 2, 14 5 “Hot Cognition: Attention” New tasks manipulate emotional content with different faces to see effect on functioning. Dot Probe Threat Bias is affective attention task anxious children orient attention to “threat”, losing some control 500ms 500ms 2500ms 5 Monday, June 2, 14 5 Results: Bias Affect, Anxiety and Attention Clusters based on Anxiet more sensitive than diag Clustering used ONLY anxiety/adaptive function scores, not 22q/TD Dx C2=Strugglers (ALL 22q): low adaptive scores, high anxious scores C1=Copers (Mostly TD): high adaptive scores, low anxiety scores replicates pattern in sample published in Angkustsiri et al, 2012 Cluster • • • • Monday, June 2, 14 Gener Replic anxiet All str Not al 6 6 anxiety and a Affect & Copers vs. Strugglers All shows: strugglers • faces Patterns of looking (from eye tracker) to different Angry: copers and strugglers look more overall at Angry vs. Neutral Not all coper • Happy: only copers look more at overall Happy vs. Neutral suggests strugglers respond differently to emotional faces E • • 7 Monday, June 2, 14 7 C e Reyes1,2, Heather Shapiro1,2, Tony J. Simon1,2 better results than diagnosis ze (EG) bias by Dx Arousal (Pupillometry) and Adaptation • A ant Angry Bias, both groups appy Bias, both groups Results: But, arousal patterns, from early toPupilometry late in experiment, are very different es based not on DX but on Dilation = increased arousal, Contraction = reduced arousal uggler status dysfunction has been documented in children with Autonomic Angry:12Copers dilate early, contract later = reducing arousal Coper vs. Struggler patterns? anxiety • Angry: Strugglers contract early, dilate later = avoid then high arousal? responses and eyeearly, movements be=voluntary • Motor Happy: Copers neither contractmay later reducing arousal again dilations or contractions are dilate involuntary • Pupil Differences Happy: Strugglers neither early, later = neutral then high arousal • Objective measure of autonomic arousal13 ptive scores may be xiety and adaptive scores anti-correlation between e5 in a novel sample sample have 22q sample are TD s - by Cluster Monday, June 2, 14 Angry vs. Neutral Trials: • Copers initially dilate to angry, but later contract, possibly showing initial arousal and later adaptation • Strugglers initially contract and later dilate, possibly indicating greater arousal with repeated exposures 8 8 “Cold” Cognitive (Inhibitory) Control Tests ability to withhold/inhibit in-appropriate responses “Go” trials (75%): press a button as quickly as possible to “whack” the mole “No-Go” trials (25%): do NOT press button to avoid “squashing” the vegetable Preceded by 1, 3, or 5 “Go” trials 5 3 1 9 Monday, June 2, 14 9 Cognitive Control - Overall Results 70 80 60 50 75 40 70 30 20 65 10 600 90 TD 22q 470 460 450 440 430 3 80 75 70 420 65 410 60 400 1Overall TD 22q 85 Accuracy (%) 85 80 ns TD 22q Response RT time (ms)(ms) Accuracy (%) (%) Accuracy 90 TD N=23 22qN=32 ] 90 480 390 5 Younger 1 Older 2 ns ns p=0.02 1 3 5 5 3 5 3 4 5 Go trials: in order following No-Go 1 5 3 3 1 1 Both groups monitor appropriately # preceding Go trials Despite tracking NoGo likelihood, children with 22q11.2DS, were much less able than TD children, to withhold response in NoGo Monday, June 2, 14 10 10 Cognitive Control - Overall Results 10 Monday, June 2, 14 10 Cognitive Control - Overall Results Full results in Shapiro et al., 2013 Frontiers in Child & Neurodev. Psychiatry 100 90 80 70 60 50 40 30 20 10 90 Accuracy (%) Accuracy (%) 100 80 70 60 50 40 7 8 9 10 11 12 13 14 15 TD−younger TD−older 22q−younger 22q−older Age Increased performance variance in older children with 22q11.2DS suggests a subgroup with poorer response inhibition than most younger children 10 Monday, June 2, 14 10 “Hot” Cognitive (Inhibitory) Control Whacking moles & protecting vegetables is all very well but ..... What happens when what you want to do really COUNTS? 11 Monday, June 2, 14 11 “Hot” Cognitive (Inhibitory) Control Whacking moles & protecting vegetables is all very well but ..... What happens when what you want to do really COUNTS? 11 Monday, June 2, 14 11 “Hot” Cognitive (Inhibitory) Control Whacking moles & protecting vegetables is all very well but ..... What happens when what you want to do really COUNTS? Whoa, that was stressfull! And that was for something that feels good! What happens if you have to control yourself when things feel bad? Monday, June 2, 14 11 11 “Hot” Cognitive (Inhibitory) Control Do emotionally salient stimuli affect the ability to withhold responses? Go trials (75%): press a button as quickly as possible to in response to Happy (50%) or Angry (50%) face No-Go trials (25%): do NOT press button in response to Neutral face Preceded by 1, 3, or 5 “Go” trials 5 3 1 12 Monday, June 2, 14 12 “Hot” Cognitive (Inhibitory) Control correct withholding Monday, June 2, 14 No-Go Accuracy (%) Original “Cold 22q11.2DS Cognition” Data TD 90 80 * Kids see 1-5 Happy or Angry faces. Press Go Then Neutral face is NoGo signal 70 60 1 3 5 No-Go Trial Type (# Preceding Go Trials) 13 “Hot” Cognitive (Inhibitory) Control 90 80 * 70 100 Emotive Go / Neutral No-Go angry Go / neutral No-Go: Percent Accuracy on NoGo Trials: Emotive Go / Neutral No−Go 90 Percent Accuracy (%)! Accuracy on NoGo trials TD: Accuracy for Happy 65-80% • close to “cold” cognition variant TD: Accuracy for Angry 65-90% • threat seems to enhance inhibition 22q: Similar but improved pattern • threat seems to enhance inhibition • ... for some but not for all! “Privileged limbic-to-PFC access?” 70 60 Percent Accuracy 80 TD: angry 22q: angry TD: happy 22q: happy 90 90 80 70 60 50 40 30 20 10 80 0 1 1 1 3 3 5 3 5 5 70 happy Go / neutral No-Go: 22q TD p2 = happy go / neutral no−go 60 100 50 40 50 Accuracy (%) TD: angry 22q: angry TD: happy Percent Accuracy on NoGo Trials: Emotive Go / Neutral No−Go 22q: happy 22q TD p1 = angry go / neutral no−go 100 Accuracy (%) 1 3 5 No-Go Trial Type (# Preceding Go Trials) 1 3 5 # preceding Go trials 1 3 # Preceding Go Trials 5 Accuracy (%) 60 100 Monday, June 2, 14 Then Neutral face is NoGo signal Kids see 1-5 Happy or Angry faces. Press Go Accuracy (%) correct withholding No-Go Accuracy (%) Original “Cold 22q11.2DS Cognition” Data TD 90 80 70 60 50 40 30 40 20 1 3 # Preceding Go Trials 1 1 1 5 3 3 3 5 5 5 13 Arousal, Anxiety & Inattention 22q = 74 Michelle Y Deng, Ph.D. Monday, June 2, 14 N % Neither 13 18 Anxiety 54 73 ADHD 38 51 Both 31 42 14 Arousal, Anxiety & Inattention 22q = 74 Neither Michelle Y Deng, Ph.D. Monday, June 2, 14 N % Neither 13 18 Anxiety 54 73 ADHD 38 51 Both 31 42 14 Arousal, Anxiety & Inattention 22q = 74 ADHD Neither Michelle Y Deng, Ph.D. Monday, June 2, 14 N % Neither 13 18 Anxiety 54 73 ADHD 38 51 Both 31 42 14 Arousal, Anxiety & Inattention 22q = 74 ADHD Anxiety Neither Michelle Y Deng, Ph.D. Monday, June 2, 14 N % Neither 13 18 Anxiety 54 73 ADHD 38 51 Both 31 42 14 Arousal, Anxiety & Inattention 22q = 74 Anxiety +ADHD ADHD Anxiety Neither Michelle Y Deng, Ph.D. Monday, June 2, 14 N % Neither 13 18 Anxiety 54 73 ADHD 38 51 Both 31 42 14 Stress, Anxiety & Psychiatric Diagnoses IQ of 75: In some domains, a 9-year-old in a 12-year-old’s world 50-60% of children with 22q11.2DS have significant anxiety 20-50% of children with 22q11.2DS get a diagnosis of ADHD (mainly Inattentive or combined type) and take medications Does “ADHD” = hyperarousal/hypervigilance from anxiety? Mismatched cognitive and social demands & resulting anxiety and avoidance might explain frequent “Autism” diagnoses Monday, June 2, 14 15 Chr. 22q11.2 Deletion Consortium 16 Monday, June 2, 14 16 Chr. 22q11.2 Deletion Consortium 16 Monday, June 2, 14 16 Chr. 22q11.2 Deletion Consortium SCHNEIDER, DEBBANÉ, BASSETT, ET AL. FIGURE 1. Age Distribution of 1,402 Participants With 22q11.2 Deletion Syndrome Assessed for Psychiatric Disorders 100 90 80 Number of Participants 70 60 50 40 30 20 10 0 6 9 12 15 18 21 24 27 30 33 36 16 39 42 45 48 51 54 57 60 63 66 69 Age (years) Monday, June 2, 14 16 Chr. 22q11.2 Deletion Consortium SCHNEIDER, DEBBANÉ, BASSETT, ET AL. FIGURE 1. Age Distribution of 1,402 Participants With 22q11.2 Deletion Syndrome Assessed for Psychiatric Disorders 100 Anxiety ~25% Anxiety 35% 90 80 Number of Participants 70 60 50 40 30 20 10 0 6 9 12 15 18 21 24 27 30 33 36 16 39 42 45 48 51 54 57 60 63 66 69 Age (years) Monday, June 2, 14 16 Chr. 22q11.2 Deletion Consortium SCHNEIDER, DEBBANÉ, BASSETT, ET AL. FIGURE 1. Age Distribution of 1,402 Participants With 22q11.2 Deletion Syndrome Assessed for Psychiatric Disorders 100 Anxiety ~25% Anxiety 35% 90 80 Number of Participants 70 60 50 40 30 Schizophrenia 41% 20 10 0 6 9 12 15 18 21 24 27 30 33 36 16 39 42 45 48 51 54 57 60 63 66 69 Age (years) Monday, June 2, 14 16 Chr. 22q11.2 Deletion Consortium SCHNEIDER, DEBBANÉ, BASSETT, ET AL. FIGURE 1. Age Distribution of 1,402 Participants With 22q11.2 Deletion Syndrome Assessed for Psychiatric Disorders 100 Anxiety ~25% Anxiety 35% 90 80 Schizophrenia 24% Number of Participants 70 60 50 40 30 Schizophrenia 41% 20 10 0 6 9 12 15 18 21 24 27 30 33 36 16 39 42 45 48 51 54 57 60 63 66 69 Age (years) Monday, June 2, 14 16 GOTHELF et al. Anxiety Appears Highly Predic4ve of 22q11.2DS Psychosis TABLE 1 Prevalence of Psychiatric Disorders at Baseline and at Follow-up Baseline Age, y, m " SD Males/females, n Any anxiety disorder, n (%) Separation anxiety disordera Specific phobia Social phobia Panic disorder Agoraphobiab PTSD OCD GAD Any mood disorder, n (%) Major depressive disorder Dysthymia Bipolar disorder I or II Any disruptive disorder, n (%) ADHDc ODDa Conduct disorderc Any psychotic disorder, n (%) Schizophrenia Schizoaffective disorder Schizophreniform disorder Brief psychotic disorder Psychotic disorder NOS Other, n (%) Substance abuseb Eating disorder Follow-up Age, m " SD Males/females, n Any anxiety disorder, n (%) Separation anxiety disordera Specific phobia Social phobia Panic disorder Agoraphobiab PTSD OCD GAD Any mood disorder, n (%) Major depressive disorder Dysthymia Bipolar disorder I or II Any disruptive disorder, n (%) ADHDc ODDa Conduct disorderc Any psychotic disorder, n (%) Schizophrenia Schizoaffective disorder Schizophreniform disorder Brief psychotic disorder Psychotic disorder NOS Monday, June 2, 14 1196 www.jaacap.org Children (n ¼ 49) 8.4 " 1.8 26/23 23 (46.9) 2 (4.1) 14 (28.6) 5 (10.2) 0 (0) 0 (0) 0 (0) 7 (14.3) 5 (10.2) 8 (16.3) 5 (10.2) 3 (6.1) 1 (5.6) 31 (63.3) 31 (63.3) 9 (18.4) 0 (0) 2 (4.1) 1 (2) 0 (0) 0 (0) 0 (0) 1 (2) 0 (0) 2 (4.1) Children (n ¼ 49) 12.4 " 2.5 26/23 18 (36.7) 1 (2) 10 (20.4) 8 (16.3) 0 (0) 0 (0) 0 (0) 2 (4.1) 7 (14.3) 2 (4.1) 2 (4.1) 0 (0) 0 (0) 29 (59.2) 28 (57.1) 9 (18.4) 0 (0) 4 (8.2) 2 (4.1) 0 (0) 0 (0) 1 (2) 1 (2) Adolescents (n ¼ 46) 14.0 " 1.9 22/24 27 (58.7) 3 (6.5) 20 (43.5) 3 (6.5) 1 (2.2) 1 (6.3) 0 (0) 8 (17.4) 4 (8.7) 5 (10.9) 1 (2.2) 5 (10.9) 0 (0) 17 (37) 14 (30.4) 10 (21.7) 0 (0) 1 (2.2) 1 (2.2) 0 (0) 0 (0) 0 (0) 0 (0) 0 (0) 0 (0) Adolescents (n ¼ 46) 18.3 " 2.9 22/24 18 (39.1) 0 (0) 13 (28.9) 0 (0) 3 (6.7) 0 (0) 0 (0) 3 (6.7) 6 (13.3) 11 (24.4) 6 (13.3) 6 (13.3) 0 (0) 15 (44.1) 12 (35.3) 2 (5.9) 1 (2.9) 8 (17.4) 5 (10.9) 0 (0) 1 (2.2) 1 (2.2) 1 (2.2) J OURNAL OF THE Adults (n ¼ 30) 27.6 " 7.2 11/19 16 (53.3) 0 (0) 10 (35.7) 3 (10.7) 0 (0) 2 (7.1) 0 (0) 4 (14.3) 2 (7.1) 8 (28.6) 5 (17.9) 5 (17.9) 0 (0) 6 (35.3) 6 (35.3) 1 (5.9) 0 (0) 10 (33.3) 5 (16.7) 2 (6.7) 2 (6.7%) 1 (3.3) 0 (0) Total (n ¼ 125) 15.1 " 8.4 59/66 66 (52.8) 5 (5.3) 44 (35.2) 11 (8.8) 1 (0.8) 3 (4) 0 (0) 19 (15.2) 11 (8.8) 21 (16.8) 11 (8.8) 13 (10.4) 1 (0.8) 54 (48.2) 51 (45.5) 19 (20) 0 (0) 13 (10.4) 7 (5.6) 2 (1.6) 2 (1.6) 1 (0.8) 1 (0.8) 3 (10) 0 (0) 3 (4) 2 (1.6) Adults (n ¼ 30) Total (n ¼ 125) 32.3 " 7.4 11/19 11 (36.7) 0 (0) 8 (26.7) 1 (3.3) 0 (0) 0 (0) 2 (6.7) 3 (10) 3 (10) 5 (16.7) 2 (6.7) 2 (6.7) 2 (6.7) 2 (11.8) 2 (11.8) 0 (0) 0 (0) 8 (26.7) 5 (16.7) 3 (10) 0 (0) 0 (0) 0 (0) 19.4 " 8.8 59/66 47 (37.6) 1 (1) 31 (25) 9 (7.3) 3 (2.4) 0 (0) 2 (1.6) 8 (6.5) 16 (12.9) 18 (14.5) 10 (8.1) 8 (6.5) 2 (2.2) 46 (46) 42 (42) 11 (11) 1 (1) 20 (16) 12 (9.6) 3 (2.4) 1 (0.8) 2 (1.6) 2 (1.6) p NS NS * *** p NS * ** NS AMERICAN ACADEMY OF C HILD & ADOLESCENT PSYCHIATRY VOLUME 52 NUMBER 11 NOVEMBER 2013 Gothelf et al. 2013 17 GOTHELF et al. Anxiety Appears Highly Predic4ve of 22q11.2DS Psychosis TABLE 1 Prevalence of Psychiatric Disorders at Baseline and at Follow-up Baseline Age, y, m " SD Males/females, n Any anxiety disorder, n (%) Separation anxiety disordera Specific phobia Social phobia Panic disorder Agoraphobiab PTSD OCD GAD Any mood disorder, n (%) Major depressive disorder Dysthymia Bipolar disorder I or II Any disruptive disorder, n (%) ADHDc ODDa Conduct disorderc Any psychotic disorder, n (%) Schizophrenia Schizoaffective disorder Schizophreniform disorder Brief psychotic disorder Psychotic disorder NOS Other, n (%) Substance abuseb Eating disorder Children (n ¼ 49) 8.4 " 1.8 26/23 23 (46.9) 2 (4.1) 14 (28.6) 5 (10.2) 0 (0) 0 (0) 0 (0) 7 (14.3) 5 (10.2) 8 (16.3) 5 (10.2) 3 (6.1) 1 (5.6) 31 (63.3) 31 (63.3) 9 (18.4) 0 (0) 2 (4.1) 1 (2) 0 (0) 0 (0) 0 (0) 1 (2) Adolescents (n ¼ 46) 14.0 " 1.9 22/24 27 (58.7) 3 (6.5) 20 (43.5) 3 (6.5) 1 (2.2) 1 (6.3) 0 (0) 8 (17.4) 4 (8.7) 5 (10.9) 1 (2.2) 5 (10.9) 0 (0) 17 (37) 14 (30.4) 10 (21.7) 0 (0) 1 (2.2) 1 (2.2) 0 (0) 0 (0) 0 (0) 0 (0) Adults (n ¼ 30) 27.6 " 7.2 11/19 16 (53.3) 0 (0) 10 (35.7) 3 (10.7) 0 (0) 2 (7.1) 0 (0) 4 (14.3) 2 (7.1) 8 (28.6) 5 (17.9) 5 (17.9) 0 (0) 6 (35.3) 6 (35.3) 1 (5.9) 0 (0) 10 (33.3) 5 (16.7) 2 (6.7) 2 (6.7%) 1 (3.3) 0 (0) Total (n ¼ 125) 15.1 " 8.4 59/66 66 (52.8) 5 (5.3) 44 (35.2) 11 (8.8) 1 (0.8) 3 (4) 0 (0) 19 (15.2) 11 (8.8) 21 (16.8) 11 (8.8) 13 (10.4) 1 (0.8) 54 (48.2) 51 (45.5) 19 (20) 0 (0) 13 (10.4) 7 (5.6) 2 (1.6) 2 (1.6) 1 (0.8) 1 (0.8) p NS NS * The predictive value of having an anxiety disorder at baseline for later development of psychosis was quite robust, as 9 of 10 patients with emerging psychotic disorder in our sample were diagnosed with an anxiety disorder at baseline. Follow-up Age, m " SD Males/females, n Any anxiety disorder, n (%) Separation anxiety disordera Specific phobia Social phobia Panic disorder Agoraphobiab PTSD OCD GAD Any mood disorder, n (%) Major depressive disorder Dysthymia Bipolar disorder I or II Any disruptive disorder, n (%) ADHDc ODDa Conduct disorderc Any psychotic disorder, n (%) Schizophrenia Schizoaffective disorder Schizophreniform disorder Brief psychotic disorder Psychotic disorder NOS Monday, June 2, 14 1196 www.jaacap.org 0 (0) 2 (4.1) Children (n ¼ 49) 12.4 " 2.5 26/23 18 (36.7) 1 (2) 10 (20.4) 8 (16.3) 0 (0) 0 (0) 0 (0) 2 (4.1) 7 (14.3) 2 (4.1) 2 (4.1) 0 (0) 0 (0) 29 (59.2) 28 (57.1) 9 (18.4) 0 (0) 4 (8.2) 2 (4.1) 0 (0) 0 (0) 1 (2) 1 (2) 0 (0) 0 (0) Adolescents (n ¼ 46) 18.3 " 2.9 22/24 18 (39.1) 0 (0) 13 (28.9) 0 (0) 3 (6.7) 0 (0) 0 (0) 3 (6.7) 6 (13.3) 11 (24.4) 6 (13.3) 6 (13.3) 0 (0) 15 (44.1) 12 (35.3) 2 (5.9) 1 (2.9) 8 (17.4) 5 (10.9) 0 (0) 1 (2.2) 1 (2.2) 1 (2.2) J OURNAL OF THE 3 (10) 0 (0) 3 (4) 2 (1.6) Adults (n ¼ 30) Total (n ¼ 125) 32.3 " 7.4 11/19 11 (36.7) 0 (0) 8 (26.7) 1 (3.3) 0 (0) 0 (0) 2 (6.7) 3 (10) 3 (10) 5 (16.7) 2 (6.7) 2 (6.7) 2 (6.7) 2 (11.8) 2 (11.8) 0 (0) 0 (0) 8 (26.7) 5 (16.7) 3 (10) 0 (0) 0 (0) 0 (0) 19.4 " 8.8 59/66 47 (37.6) 1 (1) 31 (25) 9 (7.3) 3 (2.4) 0 (0) 2 (1.6) 8 (6.5) 16 (12.9) 18 (14.5) 10 (8.1) 8 (6.5) 2 (2.2) 46 (46) 42 (42) 11 (11) 1 (1) 20 (16) 12 (9.6) 3 (2.4) 1 (0.8) 2 (1.6) 2 (1.6) *** p NS * ** NS AMERICAN ACADEMY OF C HILD & ADOLESCENT PSYCHIATRY VOLUME 52 NUMBER 11 NOVEMBER 2013 Gothelf et al. 2013 17 p values are given for age group by demographic parameter interactions determined by ANOVA for age and estimated IQ; Fisher’s exact test for sex and race. Psychopathology Symptoms are Common in 22q11.2DS Table 2. Current psychopathologies of participants with 22q11.2 deletion syndrome (22q11DS) Age group (years) Parameter All ages 8–11 12–17 18–23 524 p value Any psychopathology Co-morbidities 52 Co-morbidities 53 89 (79) 47 (42) 18 (16) 22 (85) 8 (31) 2 (8) 37 (82) 23 (51) 7 (16) 18 (82) 11 (50) 7 (32) 12 (63) 5 (26) 2 (11) N.S. Mood disorders MDD Depression NOS Mood NOS Dysthymia Bipolar I disorder Anxiety disorders GAD Anxiety NOS Separation anxiety OCD ADHD Substance/alcohol abuse Psychosis prone APS Psychotic Schizophrenia Psychosis NOS Delusional disorder 16 (14) 10 (9) 3 (3) 1 (1) 1 (1) 1 (1) 38 (34) 17 (15) 13 (12) 7 (6) 9 (8) 35 (31) 0 (0) 53 (47) 24 (21) 12 (11) 6 (5) 4 (4) 2 (2) 0 (0) 0 (0) 0 (0) 0 (0) 0 (0) 0 (0) 6 (23) 3 (12) 3 (12) 2 (8) 1 (4) 10 (38) 0 (0) 13 (50) 5 (19) 2 (8) 0 (0) 2 (8) 0 (0) 5 (11) 5 (11) 0 (0) 0 (0) 0 (0) 0 (0) 16 (36) 7 (16) 5 (11) 2 (4) 4 (9) 15 (33) 0 (0) 28 (62) 13 (29) 2 (4) 0 (0) 1 (2) 1 (2) 7 (32) 4 (18) 2 (9) 0 (0) 1 (5) 0 (0) 10 (45) 3 (14) 4 (18) 2 (9) 3 (14) 6 (27) 0 (0) 10 (45) 5 (23) 4 (18) 3 (14) 0 (0) 1 (5) 4 1 1 1 0 1 6 4 1 1 1 4 0 2 1 4 3 1 0 (21) (5) (5) (5) (0) (5) (32) (21) (5) (5) (5) (21) (0) (11) (5) (21) (16) (5) (0) N.S. N.S. 40.01 N.S. N.S. N.S. 40.001 N.S. N.S. 40.01 MDD, Major depressive disorder; NOS, not otherwise specified; GAD, generalized anxiety disorder; OCD, obsessive–compulsive disorder; ADHD, attention deficit hyperactivity disorder; APS, attenuated positive symptom syndrome; N.S., not significant (p > 0.05). Values given as n (%). p values are given for age group by diagnosis interactions determined by Fisher’s exact test. Tang et al. 2013 Monday, June 2, 14 18 p values are given for age group by demographic parameter interactions determined by ANOVA for age and estimated IQ; Fisher’s exact test for sex and race. Psychopathology Symptoms are Common in 22q11.2DS Table 2. Current psychopathologies of participants with 22q11.2 deletion syndrome (22q11DS) Age group (years) Parameter All ages 8–11 12–17 18–23 524 p value Any psychopathology Co-morbidities 52 Co-morbidities 53 89 (79) 47 (42) 18 (16) 22 (85) 8 (31) 2 (8) 37 (82) 23 (51) 7 (16) 18 (82) 11 (50) 7 (32) 12 (63) 5 (26) 2 (11) N.S. Mood disorders MDD Depression NOS Mood NOS Dysthymia Bipolar I disorder Anxiety disorders GAD Anxiety NOS Separation anxiety OCD ADHD Substance/alcohol abuse Psychosis prone APS Psychotic Schizophrenia Psychosis NOS Delusional disorder 16 (14) 10 (9) 3 (3) 1 (1) 1 (1) 1 (1) 38 (34) 17 (15) 13 (12) 7 (6) 9 (8) 35 (31) 0 (0) 53 (47) 24 (21) 12 (11) 6 (5) 4 (4) 2 (2) 0 (0) 0 (0) 0 (0) 0 (0) 0 (0) 0 (0) 6 (23) 3 (12) 3 (12) 2 (8) 1 (4) 10 (38) 0 (0) 13 (50) 5 (19) 2 (8) 0 (0) 2 (8) 0 (0) 5 (11) 5 (11) 0 (0) 0 (0) 0 (0) 0 (0) 16 (36) 7 (16) 5 (11) 2 (4) 4 (9) 15 (33) 0 (0) 28 (62) 13 (29) 2 (4) 0 (0) 1 (2) 1 (2) 7 (32) 4 (18) 2 (9) 0 (0) 1 (5) 0 (0) 10 (45) 3 (14) 4 (18) 2 (9) 3 (14) 6 (27) 0 (0) 10 (45) 5 (23) 4 (18) 3 (14) 0 (0) 1 (5) 4 1 1 1 0 1 6 4 1 1 1 4 0 2 1 4 3 1 0 (21) (5) (5) (5) (0) (5) (32) (21) (5) (5) (5) (21) (0) (11) (5) (21) (16) (5) (0) N.S. N.S. 40.01 N.S. N.S. N.S. 40.001 N.S. N.S. 40.01 MDD, Major depressive disorder; NOS, not otherwise specified; GAD, generalized anxiety disorder; OCD, obsessive–compulsive disorder; ADHD, attention deficit hyperactivity disorder; APS, attenuated positive symptom syndrome; N.S., not significant (p > 0.05). Values given as n (%). p values are given for age group by diagnosis interactions determined by Fisher’s exact test. Tang et al. 2013 Monday, June 2, 14 18 p values are given for age group by demographic parameter interactions determined by ANOVA for age and estimated IQ; Fisher’s exact test for sex and race. Psychopathology Symptoms are Common in 22q11.2DS Table 2. Current psychopathologies of participants with 22q11.2 deletion syndrome (22q11DS) Age group (years) Parameter All ages 8–11 12–17 18–23 524 p value Any psychopathology Co-morbidities 52 Co-morbidities 53 89 (79) 47 (42) 18 (16) 22 (85) 8 (31) 2 (8) 37 (82) 23 (51) 7 (16) 18 (82) 11 (50) 7 (32) 12 (63) 5 (26) 2 (11) N.S. N.S. N.S. 16 (14) with psychotic 0 (0) 5 (11) 7 (32) 4 (21) to have 40.01 We also found that those features were more likely a 10 (9) 0 (0) 5 (11) 4 (18) 1 (5) lifetime diagnosis of 3mood or anxiety disorder. (3) 0 (0) 0 (0) 2 (9) 1 (5) Mood disorders MDD Depression NOS Mood NOS Dysthymia Bipolar I disorder Anxiety disorders GAD Anxiety NOS Separation anxiety OCD ADHD Substance/alcohol abuse Psychosis prone APS Psychotic Schizophrenia Psychosis NOS Delusional disorder 1 (1) 1 (1) 1 (1) 38 (34) 17 (15) 13 (12) 7 (6) 9 (8) 35 (31) 0 (0) 53 (47) 24 (21) 12 (11) 6 (5) 4 (4) 2 (2) 0 (0) 0 (0) 0 (0) 6 (23) 3 (12) 3 (12) 2 (8) 1 (4) 10 (38) 0 (0) 13 (50) 5 (19) 2 (8) 0 (0) 2 (8) 0 (0) 0 (0) 0 (0) 0 (0) 16 (36) 7 (16) 5 (11) 2 (4) 4 (9) 15 (33) 0 (0) 28 (62) 13 (29) 2 (4) 0 (0) 1 (2) 1 (2) 0 (0) 1 (5) 0 (0) 10 (45) 3 (14) 4 (18) 2 (9) 3 (14) 6 (27) 0 (0) 10 (45) 5 (23) 4 (18) 3 (14) 0 (0) 1 (5) 1 0 1 6 4 1 1 1 4 0 2 1 4 3 1 0 (5) (0) (5) (32) (21) (5) (5) (5) (21) (0) (11) (5) (21) (16) (5) (0) N.S. Perhaps individuals with significant anxiety are at even higher risk than the 22q11DS population at large. .. NS N.S. 40.001 N.S. N.S. 40.01 MDD, Major depressive disorder; NOS, not otherwise specified; GAD, generalized anxiety disorder; OCD, obsessive–compulsive disorder; ADHD, attention deficit hyperactivity disorder; APS, attenuated positive symptom syndrome; N.S., not significant (p > 0.05). Values given as n (%). p values are given for age group by diagnosis interactions determined by Fisher’s exact test. Tang et al. 2013 Monday, June 2, 14 18 Conclusions Cognitive impairments/Developmental Delay induce stress Chronic stress likely induces anxiety, depression, reduces self-esteem Avoidance of challenge slows development further, increasing challenge Family/School/Community supports further modulate this interaction & influence “coper/struggler” trajectory reducing stress & anxiety might reduce psychosis risk 19 Monday, June 2, 14 19 Conclusions Cognitive impairments/Developmental Delay induce stress Chronic stress likely induces anxiety, depression, reduces self-esteem Avoidance of challenge slows development further, increasing challenge Family/School/Community supports further modulate this interaction & influence “coper/struggler” trajectory reducing stress & anxiety might reduce psychosis risk Strugglers can be converted to copers with child, school, family change not with stem cells or brain surgery but commonly available therapy Child: cognitive behavioral/behavioral therapy, SSRI, cognitive training School: effective IEP, careful calibration of challenge based on testing Family: coping strategies for parents, matching parent/child expectations19 Monday, June 2, 14 19 Thanks MOST important: Kids who participated & their families!! Majority of the work presented here was done by: Josh Cruz, Nina Cung, Dave Reyes, Margie Cabaral, Freddy Bassal, Heather Shapiro Ph.D., Ling Wong Ph.D., Elliott Beaton Ph.D., Siddarth Srivastava Ph.D., Michelle Deng Ph.D., Joel Stoddard, M.D., Danielle Harvey, Ph.D., Naomi Hunsaker, Ph.D., Kathy Angkustsiri M.D., Ingrid Leckliter Ph.D., Janice Enriquez Ph.D., Nicole Tartaglia M.D., Khyati Brahmbatt, M.D. UC Davis Center of Excellence in Developmental Disabilities Dempster Family Foundation National Institutes of Health/NICHD Monday, June 2, 14 20 A HUGE Thanks & Farewell! Monday, June 2, 14 21 Do Cognitive Challenges Cause Stress? Some quotes from an adult posting on facebook “it seems like I really only have a few things that stress me out. One of my big stressers is dealing with change and coins. ... I have no clue why change makes me panic, but I am trying to learn it....They don't understand that its difficult for me even if it shows the amount or not, I am not able to process it in my head. That is the most frustrating thing ever. For some reason when I am not in a rush, or when I am not feeling stressed, I can do it just fine. Math is the other big stresser, Its always going to be hard for me no matter how many classes I take, I just like to stay away from it as much as posbbile”. “I feel like this direction stuff is driving me nuts. No matter how many times we practice driving to the new spot, I still don't get it. I am completely lost. I am not making it up, it's frustrating cause I dont know why it's so confusing for me. I have to practice knowing where I'm going, and then people eventually notice, and then I get embarrassed :/((” 22 Monday, June 2, 14 22
