PROTOTYPE WEB TOOLS FOR THE WESTERN CLIMATE MAPPING INITIATIVE (WestMap) WestMap
advertisement

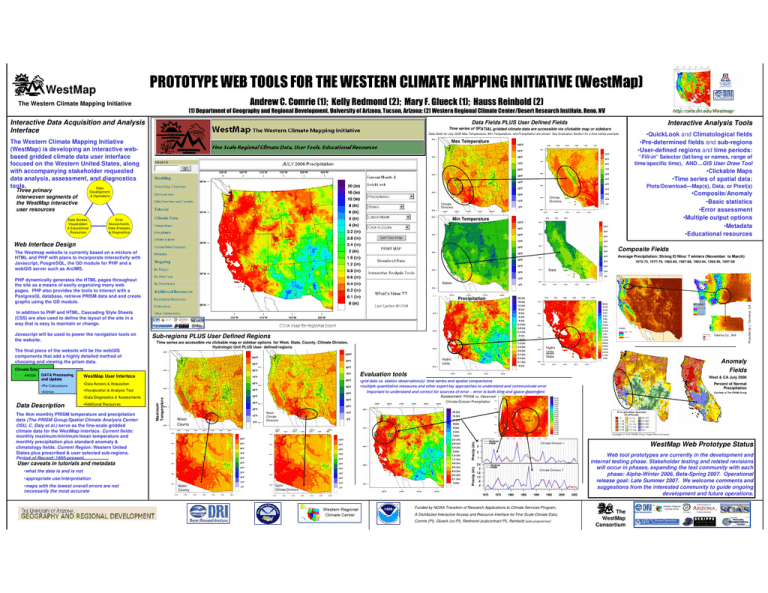
PROTOTYPE WEB TOOLS FOR THE WESTERN CLIMATE MAPPING INITIATIVE (WestMap) Andrew C. Comrie (1); Kelly Redmond (2); Mary F. Glueck (1); Hauss Reinbold (2) The Western Climate Mapping Initiative (1) Department of Geography and Regional Development, University of Arizona, Tucson, Arizona; (2) Western Regional Climate Center/Desert Research Institute, Reno, NV Interactive Data Acquisition and Analysis Interface Time series of SPATIAL gridded climate data are accessible via clickable map or sidebars Max Temperature •Clickable Maps •Time series of spatial data: Plots/Download---Map(s), Data, or Pixel(s) Min Temperature Error Assessments, Data Analyses & Diagnostics Web Interface Design Composite Fields The Westmap website is currently based on a mixture of HTML and PHP with plans to incorporate interactivity with Javascript, PosgreSQL, the GD module for PHP and a webGIS server such as ArcIMS. Average Precipitation: Strong El Nino/ 7 winters (November to March) 1972-73, 1977-78, 1982-83, 1987-88, 1993-94, 1994-95, 1997-98 State PHP dynamically generates the HTML pages throughout the site as a means of easily organizing many web pages. PHP also provides the tools to interact with a PostgresQL database, retrieve PRISM data and and create graphs using the GD module. States Precipitation In addition to PHP and HTML, Cascading Style Sheets (CSS) are also used to define the layout of the site in a way that is easy to maintain or change. The final piece of the website will be the webGIS components that add a highly detailed method of choosing and viewing the prism data. •Composite/Anomaly •Basic statistics •Error assessment •Multiple output options •Metadata •Educational resources Climate Divisions Climate Divisions Javascript will be used to power the navigation tools on the website. Composite State Map: 1970-2006/Strong La Nina /Nov-Mar Avg Precipitation Sub-regions PLUS User Defined Regions Yakima Co., WA Time series are accessible via clickable map or sidebar options for West, State, County, Climate Division, Hydrologic Unit PLUS User- defined regions Hydro Units State Hydro Units Anomaly Fields Climate Data •Pre-Calculations •Archive •Visualization & Analysis Tool •Additional Resources The 4km monthly PRISM temperature and precipitation data (The PRISM Group/Spatial Climate Analysis Center/ OSU, C. Daly et al.) serve as the fine-scale gridded climate data for the WestMap interface. Current fields: monthly maximum/minimum/mean temperature and monthly precipitation plus standard anomaly & climatology fields. Current Region: Western United States plus prescribed & user selected sub-regions. Period of Record: 1895-present. Percent of Normal Precipitation Courtesy of The PRISM Group Climate Division Precipitation West/ County West/ Climate Divisions DIV 7 WestMap Web Prototype Status Climate Division 1 User caveats in tutorials and metadata Climate Division 7 •what the data is and is not •appropriate use/interpretation •maps with the lowest overall errors are not necessarily the most accurate West & CA July 2006 •grid data vs. station observation(s): time series and spatial comparisons •multiple quantitative measures and other expert/lay approaches to understand and communicate error Important to understand and correct for sources of error ~ error is both time and space dependent Assessment: PRISM vs. Observed •Data Access & Acquisition •Data Diagnostics & Assessments Data Description Evaluation tools WestMap User Interface DI V 1 DATA Processing and Update Maximum Temperature -PRISM- •QuickLook and Climatological fields •Pre-determined fields and sub-regions •User-defined regions and time periods: “Fill-in” Selector (lat/long or names, range of time/specific time), AND…GIS User Draw Tool Development & Operations Data Access, Visualization & Educational Resources Interactive Analysis Tools Data fields for July 2006 Max Temperature, Min Temperature, and Precipitation are shown. See Evaluation Section for a time series example. The Western Climate Mapping Initiative (WestMap) is developing an interactive webbased gridded climate data user interface focused on the Western United States, along with accompanying stakeholder requested data analysis, assessment, and diagnostics tools. Data Three primary interwoven segments of the WestMap interactive user resources http://cefa.dri.edu/Westmap/ Data Fields PLUS User Defined Fields Provided by J. Tamerius, UA WestMap State/ County State/ Climate Divisions Funded by NOAA Transition of Research Applications to Climate Services Program, A Distributed Interactive Access and Resource Interface for Fine Scale Climate Data; Comrie (PI), Glueck (co-PI), Redmond (subcontract PI), Reinbold ( web programmer) Web tool prototypes are currently in the development and internal testing phase. Stakeholder testing and related revisions will occur in phases, expanding the test community with each phase: Alpha-Winter 2006, Beta-Spring 2007. Operational release goal: Late Summer 2007. We welcome comments and suggestions from the interested community to guide ongoing development and future operations. The WestMap Consortium


