Influence of Hydroclimate on Characteristics of Seasonal
advertisement
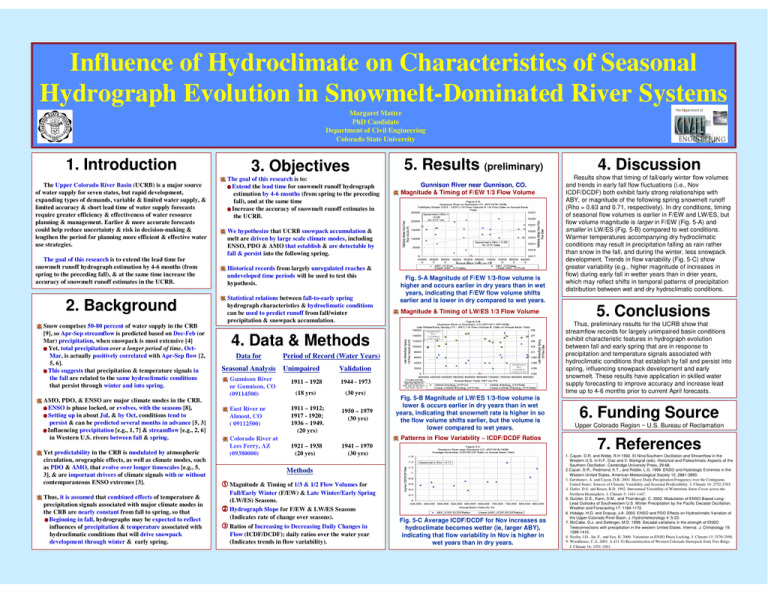
Influence of Hydroclimate on Characteristics of Seasonal Hydrograph Evolution in Snowmelt-Dominated River Systems Margaret Matter PhD Candidate Department of Civil Engineering Colorado State University 1. Introduction The Upper Colorado River Basin (UCRB) is a major source of water supply for seven states, but rapid development, expanding types of demands, variable & limited water supply, & limited accuracy & short lead time of water supply forecasts require greater efficiency & effectiveness of water resource planning & management. Earlier & more accurate forecasts could help reduce uncertainty & risk in decision-making & lengthen the period for planning more efficient & effective water use strategies. The goal of this research is to extend the lead time for snowmelt runoff hydrograph estimation by 4-6 months (from spring to the preceding fall), & at the same time increase the accuracy of snowmelt runoff estimates in the UCRB. 2. Background Snow comprises 50-80 percent of water supply in the CRB [9], so Apr-Sep streamflow is predicted based on Dec-Feb (or Mar) precipitation, when snowpack is most extensive [4] Yet, total precipitation over a longer period of time, OctMar, is actually positively correlated with Apr-Sep flow [2, 5, 6]. This suggests that precipitation & temperature signals in the fall are related to the same hydroclimatic conditions that persist through winter and into spring. AMO, PDO, & ENSO are major climate modes in the CRB. ENSO is phase locked, or evolves, with the seasons [8], Setting up in about Jul, & by Oct, conditions tend to persist & can be predicted several months in advance [5, 3] Influencing precipitation [e.g., 1, 7] & streamflow [e.g., 2, 6] in Western U.S. rivers between fall & spring. Yet predictability in the CRB is modulated by atmospheric circulation, orographic effects, as well as climate modes, such as PDO & AMO, that evolve over longer timescales [e.g., 5, 3], & are important drivers of climate signals with or without contemporaneous ENSO extremes [3]. Thus, it is assumed that combined effects of temperature & precipitation signals associated with major climate modes in the CRB are nearly constant from fall to spring, so that Beginning in fall, hydrographs may be expected to reflect influences of precipitation & temperature associated with hydroclimatic conditions that will drive snowpack development through winter & early spring. 3. Objectives The goal of this research is to: Extend the lead time for snowmelt runoff hydrograph estimation by 4-6 months (from spring to the preceding fall), and at the same time Increase the accuracy of snowmelt runoff estimates in the UCRB. 5. Results (preliminary) Gunnison River near Gunnison, CO. Magnitude & Timing of F/EW 1/3 Flow Volume We hypothesize that UCRB snowpack accumulation & melt are driven by large scale climate modes, including ENSO, PDO & AMO that establish & are detectable by fall & persist into the following spring. Historical records from largely unregulated reaches & undeveloped time periods will be used to test this Preliminary hypothesis. results Statistical relations between fall-to-early presented spring hydrograph characteristics & hydroclimatic conditions can be used to predict runoff from fall/winter precipitation & snowpack accumulation. Fig. 5-A Magnitude of F/EW 1/3-flow volume is higher and occurs earlier in dry years than in wet years, indicating that F/EW flow volume shifts earlier and is lower in dry compared to wet years. Magnitude & Timing of LW/ES 1/3 Flow Volume 4. Data & Methods ____Data for Period of Record (Water Years) Seasonal Analysis Unimpaired Validation Gunnison River nr Gunnison, CO (09114500) 1911 – 1928 1944 - 1973 (18 yrs) (30 yrs) East River nr Almont, CO ( 09112500) 1911 – 1912; 1917 - 1920; 1936 – 1949. (20 yrs) 1950 – 1979 (30 yrs) 1921 – 1938 (20 yrs) 1941 – 1970 (30 yrs) Colorado River at Lees Ferry, AZ (09380000) Fig. 5-B Magnitude of LW/ES 1/3-flow volume is lower & occurs earlier in dry years than in wet years, indicating that snowmelt rate is higher in so the flow volume shifts earlier, but the volume is lower compared to wet years. Patterns in Flow Variability ~ ICDF/DCDF Ratios Methods Magnitude & Timing of 1/3 & 1/2 Flow Volumes for Fall/Early Winter (F/EW) & Late Winter/Early Spring (LW/ES) Seasons. Hydrograph Slope for F/EW & LW/ES Seasons (Indicates rate of change over seasons). Ratios of Increasing to Decreasing Daily Changes in Flow (ICDF/DCDF); daily ratios over the water year (Indicates trends in flow variability). Fig. 5-C Average ICDF/DCDF for Nov increases as hydroclimate becomes wetter (ie, larger ABY), indicating that flow variability in Nov is higher in wet years than in dry years. 4. Discussion Results show that timing of fall/early winter flow volumes and trends in early fall flow fluctuations (i.e., Nov ICDF/DCDF) both exhibit fairly strong relationships with ABY, or magnitude of the following spring snowmelt runoff (Rho = 0.63 and 0.71, respectively). In dry conditions, timing of seasonal flow volumes is earlier in F/EW and LW/ES, but flow volume magnitude is larger in F/EW (Fig. 5-A) and smaller in LW/ES (Fig. 5-B) compared to wet conditions. Warmer temperatures accompanying dry hydroclimatic conditions may result in precipitation falling as rain rather than snow in the fall, and during the winter, less snowpack development. Trends in flow variability (Fig. 5-C) show greater variability (e.g., higher magnitude of increases in flow) during early fall in wetter years than in drier years, which may reflect shifts in temporal patterns of precipitation distribution between wet and dry hydroclimatic conditions. 5. Conclusions Thus, preliminary results for the UCRB show that streamflow records for largely unimpaired basin conditions exhibit characteristic features in hydrograph evolution between fall and early spring that are in response to precipitation and temperature signals associated with hydroclimatic conditions that establish by fall and persist into spring, influencing snowpack development and early snowmelt. These results have application in skilled water supply forecasting to improve accuracy and increase lead time up to 4-6 months prior to current April forecasts. 6. Funding Source Upper Colorado Region ~ U.S. Bureau of Reclamation 7. References 1. Cayan. D.R. and Webb, R.H 1992. El Nino/Southern Oscillation and Streamflow in the Western U.S. In H.F. Diaz and V. Markgraf (eds). Historical and Paleoclimatic Aspects of the Southern Oscillation. Cambridge University Press, 29-68. 2.Cayan, D.R., Redmond, K.T., and Riddle, L.G. 1999. ENSO and Hydrologic Extremes in the Western United States. American Meteorological Society 12: 2881-2893. 3. Gershunov, A. and Cayan, D.R. 2003. Heavy Daily Precipitation Frequency over the Contiguous United States: Sources of Climatic Variability and Seasonal Predictability. J. Climate 16: 2752-2765. 4. Gutler, D.S. and Rosen, R.D. 1992. Interannual Variability of Wintertime Snow Cover across the Northern Hemisphere. J. Climate 5: 1441-1447. 5. Gutzler, D.S., Kann, D.M., and Thornbrugh, C. 2002. Modulation of ENSO-Based LongLead Outlooks of Southwestern U.S. Winter Precipitation by the Pacific Decadal Oscillation. Weather and Forecasting 17: 1164-1172. 6. Hidalgo, H.G. and Dracup, J.A. 2003. ENSO and PDO Effects on Hydroclimatic Variation of the Upper Colorado River Basin. J. Hydrometeorology 4: 5-23. 7. McCabe, G.J. and Dettinger, M.D. 1999. Decadal variations in the strength of ENSO Teleconnections with precipitation in the western United States. Internat. J. Climatology 19: 1399-1410. 8. Neelin, J.D., Jin, F., and Syu, H. 2000. Variations in ENSO Phase Locking. J. Climate 13: 2570-2590. 9. Woodhouse, C.A. 2003. A 431-Yr Reconstruction of Western Colorado Snowpack from Tree Rings. J. Climate 16: 1551-1561.
