ECHO PERCEPTION IN WIDEBAND TELECOMMUNICATION SCENARIOS –
advertisement
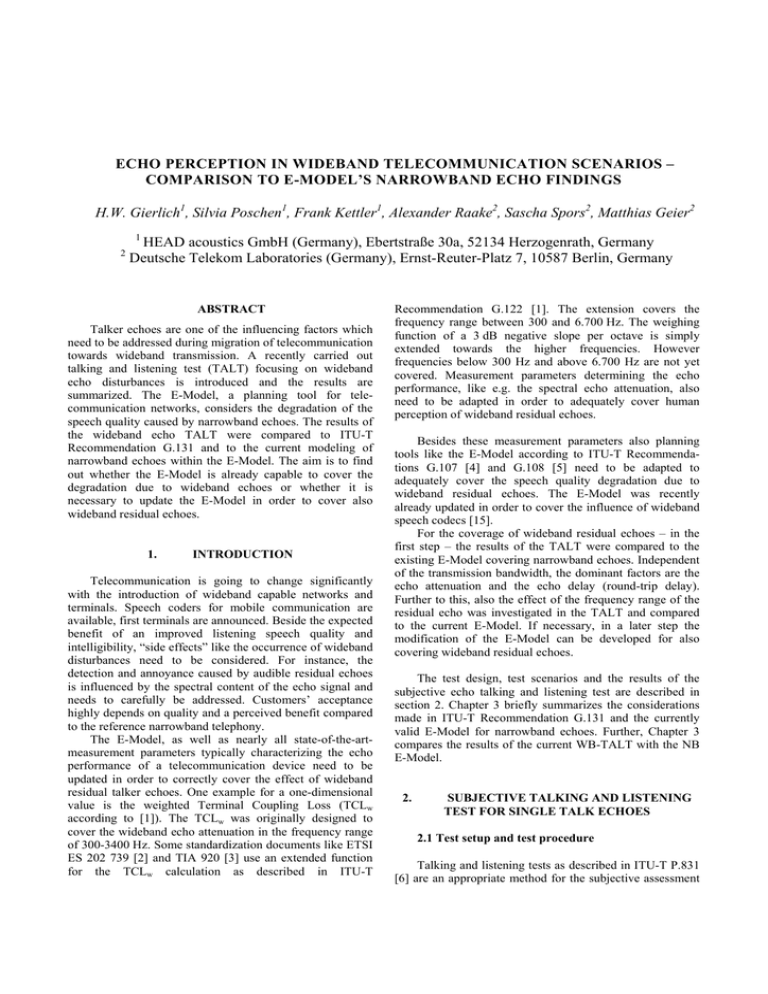
ECHO PERCEPTION IN WIDEBAND TELECOMMUNICATION SCENARIOS – COMPARISON TO E-MODEL’S NARROWBAND ECHO FINDINGS H.W. Gierlich1, Silvia Poschen1, Frank Kettler1, Alexander Raake2, Sascha Spors2, Matthias Geier2 1 2 HEAD acoustics GmbH (Germany), Ebertstraße 30a, 52134 Herzogenrath, Germany Deutsche Telekom Laboratories (Germany), Ernst-Reuter-Platz 7, 10587 Berlin, Germany ABSTRACT Talker echoes are one of the influencing factors which need to be addressed during migration of telecommunication towards wideband transmission. A recently carried out talking and listening test (TALT) focusing on wideband echo disturbances is introduced and the results are summarized. The E-Model, a planning tool for telecommunication networks, considers the degradation of the speech quality caused by narrowband echoes. The results of the wideband echo TALT were compared to ITU-T Recommendation G.131 and to the current modeling of narrowband echoes within the E-Model. The aim is to find out whether the E-Model is already capable to cover the degradation due to wideband echoes or whether it is necessary to update the E-Model in order to cover also wideband residual echoes. 1. INTRODUCTION Telecommunication is going to change significantly with the introduction of wideband capable networks and terminals. Speech coders for mobile communication are available, first terminals are announced. Beside the expected benefit of an improved listening speech quality and intelligibility, “side effects” like the occurrence of wideband disturbances need to be considered. For instance, the detection and annoyance caused by audible residual echoes is influenced by the spectral content of the echo signal and needs to carefully be addressed. Customers’ acceptance highly depends on quality and a perceived benefit compared to the reference narrowband telephony. The E-Model, as well as nearly all state-of-the-artmeasurement parameters typically characterizing the echo performance of a telecommunication device need to be updated in order to correctly cover the effect of wideband residual talker echoes. One example for a one-dimensional value is the weighted Terminal Coupling Loss (TCLw according to [1]). The TCLw was originally designed to cover the wideband echo attenuation in the frequency range of 300-3400 Hz. Some standardization documents like ETSI ES 202 739 [2] and TIA 920 [3] use an extended function for the TCLw calculation as described in ITU-T Recommendation G.122 [1]. The extension covers the frequency range between 300 and 6.700 Hz. The weighing function of a 3 dB negative slope per octave is simply extended towards the higher frequencies. However frequencies below 300 Hz and above 6.700 Hz are not yet covered. Measurement parameters determining the echo performance, like e.g. the spectral echo attenuation, also need to be adapted in order to adequately cover human perception of wideband residual echoes. Besides these measurement parameters also planning tools like the E-Model according to ITU-T Recommendations G.107 [4] and G.108 [5] need to be adapted to adequately cover the speech quality degradation due to wideband residual echoes. The E-Model was recently already updated in order to cover the influence of wideband speech codecs [15]. For the coverage of wideband residual echoes – in the first step – the results of the TALT were compared to the existing E-Model covering narrowband echoes. Independent of the transmission bandwidth, the dominant factors are the echo attenuation and the echo delay (round-trip delay). Further to this, also the effect of the frequency range of the residual echo was investigated in the TALT and compared to the current E-Model. If necessary, in a later step the modification of the E-Model can be developed for also covering wideband residual echoes. The test design, test scenarios and the results of the subjective echo talking and listening test are described in section 2. Chapter 3 briefly summarizes the considerations made in ITU-T Recommendation G.131 and the currently valid E-Model for narrowband echoes. Further, Chapter 3 compares the results of the current WB-TALT with the NB E-Model. 2. SUBJECTIVE TALKING AND LISTENING TEST FOR SINGLE TALK ECHOES 2.1 Test setup and test procedure Talking and listening tests as described in ITU-T P.831 [6] are an appropriate method for the subjective assessment of echo disturbances. Test persons are asked to speak into a phone or other type of terminal equipment and to judge the echo impairment. Self-masking due to ones own voice is considered in a realistic way in this scenario. If the utterances for the test persons are limited to a short but sufficient duration (typically a few seconds), the tests can be carried out in a very efficient way and provide a high amount of results within a limited time. The tests were conducted using a wideband echo simulator. The principal set-up is shown in Figure 2.1. As acoustical interface, a commercially available headset was selected to be connected to the internal sound card of the echo simulation PC. Using the online filters and gain settings of the echo simulator, the sending and receiving frequency responses as well as the sending and receiving loudness rating of the headset were adjusted to those of “normal” wideband telephones. According to ETSI ES 202 739 [2] the sending loudness rating was adjusted to SLR = 8 dB, the receiving loudness rating to RLR = 2 dB. The frequency responses were adjusted by correction filters in order to fulfill the tolerance schemes currently suggested in ETSI ES 202 739 [2] and [7]. implementations were tested. The filter denoted as “WB_F1” limits the frequency content to a frequency range between approximately 100 Hz up to 1.3 kHz. A narrowband scenario (300 Hz to 3.4 kHz, designation “NB”) and two different wideband scenarios (“WB_F2”, 3.1 kHz to 5.6 kHz; “WB_F3”, 5.2 kHz to 8 kHz) were included. L/dB L/dB 20 WB_F1 NB 10 100 200 f/Hz 2000 5000 0 -10 -10 -20 -20 -30 -30 -40 -40 10k 20k L/dB 50 100 200 f/Hz 2000 5000 -50 10k 20k L/dB 20 WB_F2 10 20 WB_F3 10 0 0 -10 -10 -20 -20 -30 -30 -40 -40 -50 50 100 200 f/Hz 2000 5000 10k 20k 10 0 -50 50 20 -50 50 100 200 f/Hz 2000 5000 10k 20k Figure 2.2: Gain functions of echo shaping filter The echo attenuation adjustment in the simulator was determined by the un-weighted level difference between the send and echo signals. The adjustment was based on a real speech signal. A total number of 129 different echo conditions were tested. Figure 2.1: Block diagram of echo simulator In order to also consider the sidetone between mouth and ear of humans, this specific headset was selected since it most realistically reproduces the “natural” sidetone of humans [8]. For verification, the sidetone masking rating STMR according to ITU-T Recommendation P.79 [9] Annex A was measured using an artificial head measurement system according to ITU-T Recommendation P.58 [10], equipped with two artificial ears (type 3.4) according to ITU-T Recommendation P.57 [11]. While the natural sidetone measured with this artificial head measurement system leads to an STMR value of 16.5 dB, the selected headset provides an STMR of 17.5 dB. Both results are within the range specified in ETSI ES 202 739 [2]. The test conditions combined round-trip delays between 100 ms and 500 ms (four settings), four echo attenuation settings between 25 and 55 dB, and 4 different echo filters of different shapes. The corresponding gain functions are shown in Figure 2.2. Beside a pure attenuation over the whole frequency range (denoted as “WB”), different filter The talking and listening tests were conducted with 19 test subjects. All participants were native German speakers. The headset microphone was positioned relative to the test persons’ mouth in a similar way for all participants. The echo signal was monaurally displayed on the right headset loudspeaker in order to simulate a monaural telephone situation. The task for the test persons was to simulate a salutation typical of the beginning of a telephone call. The sentences were provided in printed form. The test sentence was pre-defined in order to achieve a limited duration, and to use utterances with fricatives at word ends. Furthermore, this task is easy to conduct. The echo disturbance was assessed using a five point DCR scale according to ITU-T P.800 [12]: 5 – echo is inaudible to 1 – echo is very annoying. The individual ratings are averaged to form mean opinion scores (MOS). The confidence interval (CI) is calculated based on a 95 % confidence level. 2.2 Test results The MOS analysis of the entire test conditions demonstrated that the test persons used the whole quality scale from MOS 1 up to MOS 5. Reference conditions without any echo were assessed with 5.0 points on the MOS scale indicating that the task was easy to conduct for the test subjects. This could also be confirmed by individual interviews held after the tests. As an example, Figure 2.3 depicts the MOS results together with the CIs for an echo attenuation of 46 dB as a function of the different echo shaping filters and echo delays. The filters are identified by labels on the x-axis. The bars represent round-trip delays of 100 ms, 200 ms, 300 ms and 500 ms respectively. MOS vs echo filter for 46 dB attenuation 100ms 200ms 300ms 500ms critical compared to the other test cases. This may be explained by the higher self-masking due to one’s own voice in the low frequency range [8]. MOS vs echo filter for 200 ms round trip delay 35 dB 40 dB 46 dB 5.0 4.5 4.0 3.5 3.0 2.5 2.0 1.5 1.0 WB NB WB_F1 WB_F2 WB_F3 Figure 2.4: MOS results for 200 ms round-trip delay 3. COMPARISON TO G.131 AND E-MODEL 5.0 3.1 Narrowband talker echoes in the context of G.131 and the E-model 4.5 4.0 3.5 3.0 2.5 2.0 1.5 1.0 WB NB WB_F1 WB_F2 WB_F3 Figure 2.3: MOS results vs. echo shaping filter The results demonstrate that the MOS values are significantly lower for the filter characteristic denoted as WB_F2. Echoes of frequency content between 3.1 kHz and 5.6 kHz seem to be easier to detect, and therefore are more annoying for test subjects as compared to the other filter conditions. Taking into account also the results for other echo attenuations (not shown here), MOS differences of up to 2 points occur between low frequency echo disturbances (WB_F1), narrowband scenarios (NB) and high frequency echoes (WB_F2). This is especially relevant for a realistic test case of 46 dB echo attenuation, as this is a value often required for terminals. A similar effect can even be observed for the highest tested echo attenuation of 55 dB (not shown here). The MOS scores vary between approximately 4.5 and 5 for the pure attenuation over the entire frequency range (“WB”); the results for the “WB_F2” filter lie around 4.0 MOS indicating that the echo is audible, but not annoying. It should also be considered that terminals for VoIP applications need to fulfill the requirement of 55 dB echo attenuation [3]. This is seems to be especially critical in the frequency range of “WB_F2”. A similar analysis is shown in Figure 2.4 for 200 ms round-trip delay and different echo attenuation (between 35 and 46 dB). The low pass filter between approximately 200 Hz up to 1.3 kHz (“WB_F1”) is significantly less According to ITU-T Recommendation G.131 [13] the degree of annoyance due to talker echo depends on two factors: the amount of delay in the connection and the level difference between the original voice and the perceived echo signal (echo attenuation). Figure 1 of ITU-T Rec. G.131 [13] shows two curves indicating the minimum requirement on the talker echo loudness rating (TELR = SLR + RLR + Echo attenuation) as a function of the mean one-way connection delay. Two curves are given: The “acceptable” curve indicates the TELR requirement that needs to be fulfilled to satisfied 99 % of the users. Thus, only 1 % of the users are expected to encounter objectionable echo. The “limiting case” curve requires a 6 dB lower TELR than the acceptable curve, thus about 10 % of the users would observe an objectionable echo. The E-Model [4] determines the transmission quality using the rating factor R. This factor is composed of several elements: R = R0 – Is – Id – Ie-eff + A. R0 represents the quality due to the basic signal to noise ratio, the factor Is is the impairment due to a combination of all degradations which occur mainly simultaneously with the voice signal. In contrast, the factor Id represents the degradations caused by the transmission delay. Modelinternally, R0, Is and Id are further subdivided into several separate impairment values. These can be found in ITU-T Recommendation G.107 [4]. The effective equipment impairment factor Ie-eff represents impairments caused by low bit rate codecs and due to package loss of uniform distribution. The advantage factor A is a measure of the users’ expectations, and, for example, may capture the advantage of access for the user due to mobile telephony. The talker echo is considered in the impairment factor Id. Id is further subdivided into the impairments due to talker and listener echoes as well as the impairments caused by too long absolute delays, see equations 3-18 of ITU-T Recommendation G.107 [4]. The influence of TELR on Id is calculated depending on the sidetone masking rating (STMR). Low STMR values of STMR < 9 dB lead to high level sidetones and may therefore have some masking effects on the talker echo. Echo attenuation = TELR − 10 dB , where SLR + RLR are supposed to be 7 dB + 3 dB = 10 dB or 8dB + 2 dB = 10 dB respectively. More important than the consideration of STMR is the influence of transmission delay. Thus, the amendment 1 to ITU-T Recommendation G.108 [5] provides several figures which depict the correlation between TELR, the one-way transmission delay (mouth to ear delay) and the E-Model’s Transmission Rating Factor R. The higher R is, the higher is the estimated transmission quality. For example, an R-value between 90 and 100 represents the best possible speech quality, an R between 80 and 90 corresponds to a high speech transmission quality. For R-values between 70 and 80, some users are supposed to be dissatisfied, thus, a medium speech transmission quality is expected. Rating factors below 50 are not recommended. The “acceptable” and “limiting case” curves given in ITU-T Recommendation G.131 correspond to E-Model rating of factors R = 74 and R = 60 respectively. Note that the TALT as well as the findings of G.131 and the E-Model are based on single talk echo conditions. Thus, the echo perception during double talk conditions needs to be investigated separately. 3.2 Comparison of listening test results to G.131 In the following, the results of the wideband talking and listening tests were compared to the curves provided in Figure 1 of ITU-T Rec. G.131 and which were again shown in Figure 3.1. The relationship between TELR and delay as described in G.131 (Figure 1 of that document) are the results of a third party listening-only test. For G.131, the residual echoes were assessed on a 5-point DCR MOS scale according to ITU-T recommendation P.800 [12]. For the “acceptable” curve, MOS scores of 4.0 to 4.6 were achieved. MOS scores of 3.5 to 4.0 are indicated by the “limiting case” curve (see section 3 and table II.1 of [13]). Figure 3.2 and 3.3 compare the results of the TALT to the condition pairs (round-trip delay and echo attenuation) leading to the “acceptable” and “limiting case” curves of ITU-T recommendation G.131 [13]. In both figures, the xaxis indicates the combination of round-trip and echo attenuation defining the G.131-curve. E. g., “100_30” indicates a round-trip delay of 100 ms and 30 dB echo attenuation, which corresponds to a TELR of 40 dB: Figure 3.1: Talker echo tolerance curves acc. ITU Rec. G.131 Note that in G.131 the mean one-way transmission time was indicated, whereas Figures 3.2 and 3.3 indicate the round-trip delay which is identical to two times the mean one-way delay. Furthermore, the attenuations given on the x-axis may deviate from those shown in G.131 by ± 2 dB, since in the TALT only discrete echo attenuations of 30 dB, 35 dB, 40 dB and so forth were used. It should also be taken into account, that the TELR in G.131 is based on the TCLw calculation [1], whereas the un-weighted echo attenuation was used for the TALT design. The conditions indicated on the x-axis of Figure 3.2 and 3.3 therefore indicate the pairs of round-trip delay and TELR leading to an acceptable or limiting-case single talk echo performance. Thus, the MOS scores given on the yaxis in both figures are supposed to be constant for the test conditions given on the x-axis. For the comparison to the “acceptable” curve, the MOS scores are supposed to be in a range of 4.0 – 4.6 as described in section 3.1. The MOS scores vs. the “acceptable” curve conditions are given in Figure 3.2 for each of the used echo filters. The MOS values are only constant and of the expected amount for the filter “WB_F1”. The MOS scores for the filters “WB”, “NB” and “WB_F3” are not constant. They rise from about 2.3 MOS for 100 ms round-trip delay and 30 dB echo attenuation to about 4.3 for 500 ms and 46 dB echo attenuation. Thus, only for higher round-trip delays the expected MOS of 4.0 or higher is achieved. This is especially surprising for the NB echo filter, since this filter leads to “narrowband” echoes in the frequency range of 300 – 3400 Hz and is therefore comparable to the echoes assessed for the results shown in G.131 figure 1. The MOS scores for WB_F2 are significantly lower and increase from 2.0 – 3.0 for 500 ms roundtrip delay. Comparison to G.131 - "acceptable" curve 5.0 4.5 4.0 MOS 3.5 3.0 2.5 2.0 WB NB WB_F1 WB_F2 WB_F3 1.5 1.0 100_30 150_35 250_40 300_40 400_46 500_46 Condition acc. G.131 (delay / ms _ overall attenuation / dB) Figure 3.3: MOS comparison of TALT results to “acceptable” curve of ITU-T Recommendation G.131 [13] This is already indicated by the results discussed in section 2.2. It seems that humans are especially sensitive for echoes in the frequency range of 3.1 to 5.6 kHz (represented by “WB_F2”). This correlates with the human hearing threshold which is most sensitive for speech and music perception in basically the same frequency range. In the contrary “WB_F1” corresponds to echoes which are mostly masked by the test person’s own voice [8]. Comparison to G.131 - "limiting case" curve 5.0 WB NB WB_F1 WB_F2 WB_F3 4.5 MOS 4.0 3.5 3.0 2.5 2.0 1.5 1.0 100_25 150_30 200_30 300_35 400_35 500_35 Condition (delay/ms _ overall attenuation/dB) Figure 3.3: MOS comparison of TALT results to “limiting case” curve of ITU-T Recommendation G.131 [13] Figure 3.3 shows the comparison to the test condition pairs of the G.131 limiting case curve. Again, the resulting MOS scores for the different echo shaping filters are expected to be constant and within a range of 3.5 – 4.0 MOS. This is again only fulfilled for the filter “WB_F1”, leading to residual echoes in a frequency range of 100 to 1.300 Hz. The MOS scores for the filters “WB”, “NB” and “WB_F3” are again similar and rise from 1.7 to approximately 2.8 MOS. The most critical shaping filter “WB_F2” again leads to the lowest results of about 2.0 MOS for all pairs of echo attenuation and delay. In summary, it can be stated that the results of the recently carried out echo TALT differ from the third party listening-only test that lead to the curves given in ITU-T Rec. G.131. Note that both only regarded single talk echoes and do not take into account double talk situations. The differences may be caused by: - The different types of listening test (talking and listening test vs. third party listening-only tests). The test subjects in the TALT assessed residual echoes of their own voice. Additionally, the speech level of each person was naturally different. Thus, the assessed echoes may have varied for each test person, while they have been exactly identical for the G.131 test. - The effect of the self-masking. The test persons of the TALT masked their echo with their own voice. In turn, the persons of the G.131-test listened to the echo masked by the speaker. - The fact that the test conditions of the TALT vary from those of G. 131: wideband echoes in the frequency range of 100 – 8.000 Hz, narrowband echoes as well as echoes with other band-limitations are presented in our tests. For G.131, only narrowband echoes were assessed. 3.3 Comparison of listening test results to E-Model The Figures 3.4 to 3.6 compare the TALT results to figure I.2a of ITU-T Rec. G.108, Amendment 1 [14], where different E-model predictions are provided. On the x-axis, the round-trip delay of the echo signal is indicated. Figure I.2a of G.108, Am. 1 shows the mean oneway delay of the echo path. On the y-axis, the echo attenuation is given (Echo attenuation = TELR - 10dB). Four thin lines are drawn in each of the Figures 3.4 to 3.6 which correspond to the iso-quality-contours for the E-Model transmission rating factors R = 90, 80, 74 and 60, respectively. R = 74 corresponds to the “acceptable” curve of G.131, and a MOS score of 4.0 – 4.6. For each of the five echo filters, the pair of round-trip delay and echo attenuation is determined, which will lead to a MOS of 4.5. These conditions are given separately for each echo filter in Figure 2.2. The results of “WB_F1” match the curve for R = 74 relatively well. The other filters require a 10 to 20 dB higher echo attenuation in order to lead to an “acceptable” performance. A 10 dB higher echo attenuation is required for the echo shaping filters “WB” and “NB”. This is surprising, since it indicates that there seems to be no perceptual difference for narrowband or wideband residual echoes. If the frequency range of the residual echo is restricted especially to the frequency range above 3400 Hz an attenuation of app. 45 to 60 dB is necessary to yield an MOS of 4.5. Compared to the E-Model R factors, these conditions follow the curve for R = 90 which would indicate a very high transmission quality. Echo attenuation (= TELR - 10dB) MOS = 4.5 compared to G.108 R factors 65 60 WB 55 NB 50 WB_F1 45 WB_F2 WB_F3 40 R = 90 35 R = 80 30 R = 74 R = 60 25 20 0 100 200 300 400 500 600 Round-trip delay (ms) Figure 3.4: Echo attenuation leading to MOS ≈ 4.5 vs. round-trip delay for echo filters compared to different R factors of ITU-T Recommendation G.108 Amendment 1 [14] frequencies [8]. The self-masking within the TALT seems to be especially low for residual echoes in a frequency range 3 – 5 kHz. In order to integrate the degradation due to wideband echoes into the E-Model, two further steps need to be carried out: further subjective evaluations need to be conducted to find out whether narrowband echoes are assessed differently in subjective tests with only narrowband conditions and in subjective tests with echoes of different bandwidths. Furthermore, in these future subjective tests specific conditions with round-trip delay and echo attenuation pairs should be integrated in order to link them to the E-Model R-factors for narrowband echoes and also for wideband and band-limited echoes. Secondly, the results of this subjective evaluation shall be used to develop a “generic weighting function” which may be used to derive the required echo attenuation depending on the round-trip delay as well as on the spectral characteristic of the residual echo. Echo attenuation (= TELR - 10dB) MOS = 4.0 compared to G.108 R factors 65 WB 60 Echo attenuation (= TELR - 10dB) MOS = 3.5 compared to G.108 R factors Figure 3.4 and 3.5 show similar graphs as Figure 3.3, however with the MOS estimations set to 4.0 and 3.5 (corresponding to R-values of 79 and 68 respectively). They can be used as comparison to the limiting case curve of G.131, which corresponds to R = 60. Again only the echo filter “WB_F1” leads to results correlating to the R = 60 curve in Figure 3.4 and 3.5. For both MOS scores, the required echo attenuation depending on the round-trip delay for the “WB” and the “NB” echo filters are nearly identical. To achieve these MOS scores, a higher echo attenuation is again required for the band-limited filters “WB_F2” and “WB_F3”. While the required echo attenuation leading to a MOS of 4.5 is only slightly lower for “WB_F3” compared to “WB_F2”, the required echo attenuations deviate by app. 10 dB if a MOS 3.5 is to be achieved. 65 60 WB 55 NB WB_F1 50 WB_F2 45 WB_F3 40 R = 90 R = 80 35 R = 74 30 R = 60 25 20 0 100 200 300 400 500 600 Round-trip delay (ms) Figure 3.6: Echo attenuation leading to MOS ≈ 3.5 vs. round-trip delay for echo filters compared to different R factors of ITU-T Recommendation G.108 Amendment 1 [14] This “generic weighting function” then can be used for an update of the E-Model which will consider echoes of any bandwidth in the range of 50 to 7000 Hz. NB 55 WB_F1 50 WB_F2 45 WB_F3 R = 90 40 4. SUMMARY & CONCLUSION R = 80 35 R = 74 30 R = 60 25 20 0 100 200 300 400 500 600 Round-trip delay (ms) Figure 3.5: Echo attenuation leading to MOS ≈ 4.0 vs. round-trip delay for echo filters compared to different R values of ITU-T Rec. G.108 Amendment 1 [14] Again it can be expected that these results directly correlate with the threshold of hearing and speech perception. The self masking of one’s own voice is higher for the lower frequency range and lower for higher The results of a talking and listening test for the assessment of differently filtered echo signals were presented. Wideband echoes (50 – 7.000 Hz) as well as narrowband echoes (300 – 3400 Hz) as well as further bandlimited residual echoes were assessed for several combinations of echo attenuation and round-trip delay. The results were compared to the relationships of required echo attenuation and round-trip delay for narrowband scenarios as given by ITU-T Recommendation G.131 and ITU-T Recommendation G.108. Since for wideband echoes the required echo attenuation needs to be sufficiently high especially the in frequency range above 3.4 kHz, a proposal is given in order to run further subjective evaluations. They can be used for the development of a “generic weighting function” to adequately consider the degradation due to echoes of any bandwidth between 50 – 7000 Hz in the context of the E-Model network planning tool. 5. REFERENCES [1] ITU-T Recommendation G.122, Influence of national systems on stability and talker echo in international connections, 1993 [2] ETSI ES 202 739, STQ; Transmission requirements for wideband VoIP terminals (handset and headset) from QoS perspective as perceived by the user, 2007 [3] TIA 920, Transmission Requirements for Wideband Digital Wireline Telephones, 2002 [4] ITU-T Recommendation G.107, The E-model, a computational model for use in transmission planning, March 2005 [5] ITU-T Recommendation G.108, Application of the E-model: A planning guide, Sept. 1999 [6] ITU-T Recommendation P.831, Subjective performance evaluation of network echo cancellers, 1998 [7] Testing Wideband Terminals, S. Poschen1, F. Kettler1, A. Raake2, S. Spors2, 1HEAD acoustics, Herzogenrath, Germany, 2 Deutsche Telekom Laboratories, Berlin, Germany, DAGA, Jahrestagung der Deutschen Gesellschaft für Akustik, 2008, [8] Eigenwahrnehmung der Stimme in auditiven virtuellen Umgebungen, Ph.D. VDI Fortschritt-Berichte, Nr. 666, 2001, Christoph Pörschmann [9] ITU-T Recommendation P.79, Calculation of Loudness Ratings for Telephone Sets, Annex A, Nov. 2007 [10] ITU-T Recommendation P.58, Head and Torso Simulators for Telephonometry, 1996 [11] ITU-T Recommendation P.57, Artificial Ears, 1996 [12] ITU-T Recommendation P.800, Methods for Subjective Determination of Transmission Quality 1996 [13] ITU-T Recommendation G.131, Talker echo and its control, Nov. 2003 [14] ITU-T Recommendation G.108, Amendment 1, New Appendix I - The relationship between and interaction of talker echo and absolute delay, Sept. 2003 [15] ITU-T Recommendation G.107, Amendment 1, New Appendix II – Provisional impairment factor framework for wideband speech transmission, June. 2006
