Quantification and Comparison of Pollution Generated by a Door-to-Door Demand
advertisement
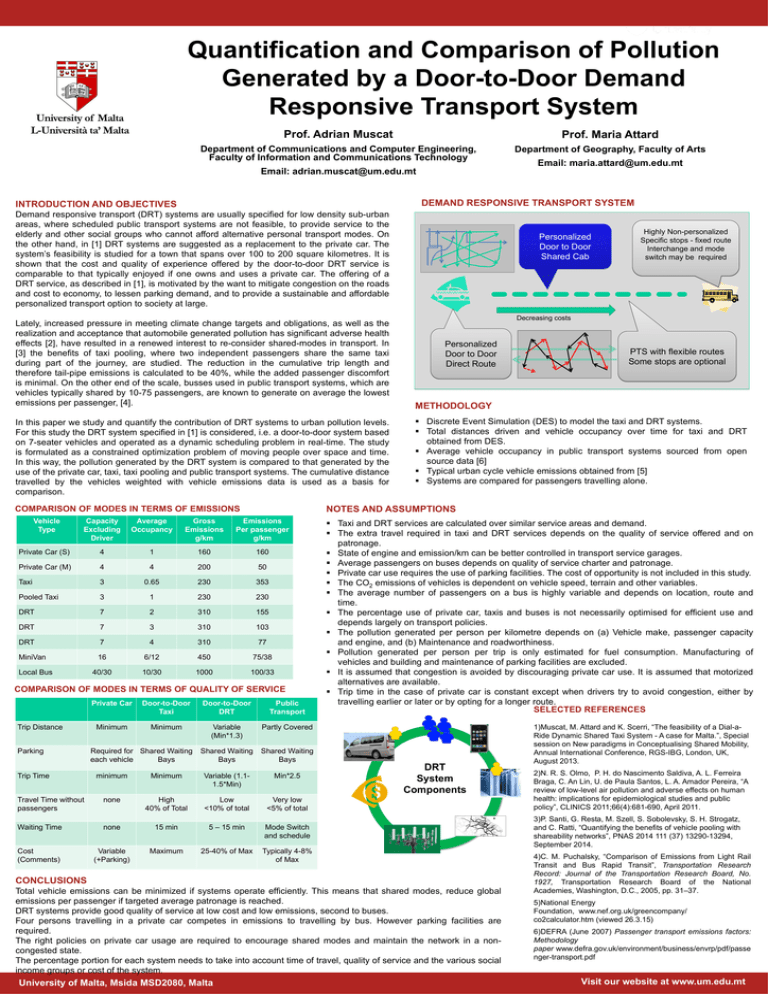
Quantification and Comparison of Pollution Generated by a Door-to-Door Demand Responsive Transport System Prof. Adrian Muscat Prof. Maria Attard Department of Communications and Computer Engineering, Faculty of Information and Communications Technology Department of Geography, Faculty of Arts Email: maria.attard@um.edu.mt Email: adrian.muscat@um.edu.mt DEMAND RESPONSIVE TRANSPORT SYSTEM INTRODUCTION AND OBJECTIVES Demand responsive transport (DRT) systems are usually specified for low density sub-urban areas, where scheduled public transport systems are not feasible, to provide service to the elderly and other social groups who cannot afford alternative personal transport modes. On the other hand, in [1] DRT systems are suggested as a replacement to the private car. The system’s feasibility is studied for a town that spans over 100 to 200 square kilometres. It is shown that the cost and quality of experience offered by the door-to-door DRT service is comparable to that typically enjoyed if one owns and uses a private car. The offering of a DRT service, as described in [1], is motivated by the want to mitigate congestion on the roads and cost to economy, to lessen parking demand, and to provide a sustainable and affordable personalized transport option to society at large. Lately, increased pressure in meeting climate change targets and obligations, as well as the realization and acceptance that automobile generated pollution has significant adverse health effects [2], have resulted in a renewed interest to re-consider shared-modes in transport. In [3] the benefits of taxi pooling, where two independent passengers share the same taxi during part of the journey, are studied. The reduction in the cumulative trip length and therefore tail-pipe emissions is calculated to be 40%, while the added passenger discomfort is minimal. On the other end of the scale, busses used in public transport systems, which are vehicles typically shared by 10-75 passengers, are known to generate on average the lowest emissions per passenger, [4]. In this paper we study and quantify the contribution of DRT systems to urban pollution levels. For this study the DRT system specified in [1] is considered, i.e. a door-to-door system based on 7-seater vehicles and operated as a dynamic scheduling problem in real-time. The study is formulated as a constrained optimization problem of moving people over space and time. In this way, the pollution generated by the DRT system is compared to that generated by the use of the private car, taxi, taxi pooling and public transport systems. The cumulative distance travelled by the vehicles weighted with vehicle emissions data is used as a basis for comparison. COMPARISON OF MODES IN TERMS OF EMISSIONS Vehicle Type Average Occupancy Gross Emissions g/km Emissions Per passenger g/km Private Car (S) 4 1 160 160 Private Car (M) 4 4 200 50 Taxi 3 0.65 230 353 Pooled Taxi 3 1 230 230 DRT 7 2 310 155 DRT 7 3 310 103 DRT 7 4 310 77 MiniVan 16 6/12 450 75/38 40/30 10/30 1000 100/33 COMPARISON OF MODES IN TERMS OF QUALITY OF SERVICE Trip Distance Parking Trip Time Travel Time without passengers Private Car Door-to-Door Taxi Door-to-Door DRT Public Transport Minimum Minimum Variable (Min*1.3) Partly Covered Shared Waiting Bays Shared Waiting Bays Required for Shared Waiting each vehicle Bays Decreasing costs Personalized Door to Door Direct Route minimum Minimum Variable (1.11.5*Min) Min*2.5 none High 40% of Total Low <10% of total Very low <5% of total Waiting Time none 15 min 5 – 15 min Mode Switch and schedule Cost (Comments) Variable (+Parking) Maximum 25-40% of Max Typically 4-8% of Max METHODOLOGY Discrete Event Simulation (DES) to model the taxi and DRT systems. Total distances driven and vehicle occupancy over time for taxi and DRT obtained from DES. Average vehicle occupancy in public transport systems sourced from open source data [6] Typical urban cycle vehicle emissions obtained from [5] Systems are compared for passengers travelling alone. Taxi and DRT services are calculated over similar service areas and demand. The extra travel required in taxi and DRT services depends on the quality of service offered and on patronage. State of engine and emission/km can be better controlled in transport service garages. Average passengers on buses depends on quality of service charter and patronage. Private car use requires the use of parking facilities. The cost of opportunity is not included in this study. The CO2 emissions of vehicles is dependent on vehicle speed, terrain and other variables. The average number of passengers on a bus is highly variable and depends on location, route and time. The percentage use of private car, taxis and buses is not necessarily optimised for efficient use and depends largely on transport policies. The pollution generated per person per kilometre depends on (a) Vehicle make, passenger capacity and engine, and (b) Maintenance and roadworthiness. Pollution generated per person per trip is only estimated for fuel consumption. Manufacturing of vehicles and building and maintenance of parking facilities are excluded. It is assumed that congestion is avoided by discouraging private car use. It is assumed that motorized alternatives are available. Trip time in the case of private car is constant except when drivers try to avoid congestion, either by travelling earlier or later or by opting for a longer route. SELECTED REFERENCES DRT System Components CONCLUSIONS Total vehicle emissions can be minimized if systems operate efficiently. This means that shared modes, reduce global emissions per passenger if targeted average patronage is reached. DRT systems provide good quality of service at low cost and low emissions, second to buses. Four persons travelling in a private car competes in emissions to travelling by bus. However parking facilities are required. The right policies on private car usage are required to encourage shared modes and maintain the network in a noncongested state. The percentage portion for each system needs to take into account time of travel, quality of service and the various social income groups or cost of the system. University of Malta, Msida MSD2080, Malta PTS with flexible routes Some stops are optional NOTES AND ASSUMPTIONS Capacity Excluding Driver Local Bus Personalized Door to Door Shared Cab Highly Non-personalized Specific stops - fixed route Interchange and mode switch may be required 1)Muscat, M. Attard and K. Scerri, “The feasibility of a Dial-aRide Dynamic Shared Taxi System - A case for Malta.”, Special session on New paradigms in Conceptualising Shared Mobility, Annual International Conference, RGS-IBG, London, UK, August 2013. 2)N. R. S. Olmo, P. H. do Nascimento Saldiva, A. L. Ferreira Braga, C. An Lin, U. de Paula Santos, L. A. Amador Pereira, “A review of low-level air pollution and adverse effects on human health: implications for epidemiological studies and public policy”, CLINICS 2011;66(4):681-690, April 2011. 3)P. Santi, G. Resta, M. Szell, S. Sobolevsky, S. H. Strogatz, and C. Ratti, “Quantifying the benefits of vehicle pooling with shareability networks”, PNAS 2014 111 (37) 13290-13294, September 2014. 4)C. M. Puchalsky, “Comparison of Emissions from Light Rail Transit and Bus Rapid Transit”, Transportation Research Record: Journal of the Transportation Research Board, No. 1927, Transportation Research Board of the National Academies, Washington, D.C., 2005, pp. 31–37. 5)National Energy Foundation, www.nef.org.uk/greencompany/ co2calculator.htm (viewed 26.3.15) 6)DEFRA (June 2007) Passenger transport emissions factors: Methodology paper www.defra.gov.uk/environment/business/envrp/pdf/passe nger-transport.pdf Visit our website at www.um.edu.mt
