Estimation of Surface Winds From Upward Looking Acoustic Doppler Current Profilers
advertisement
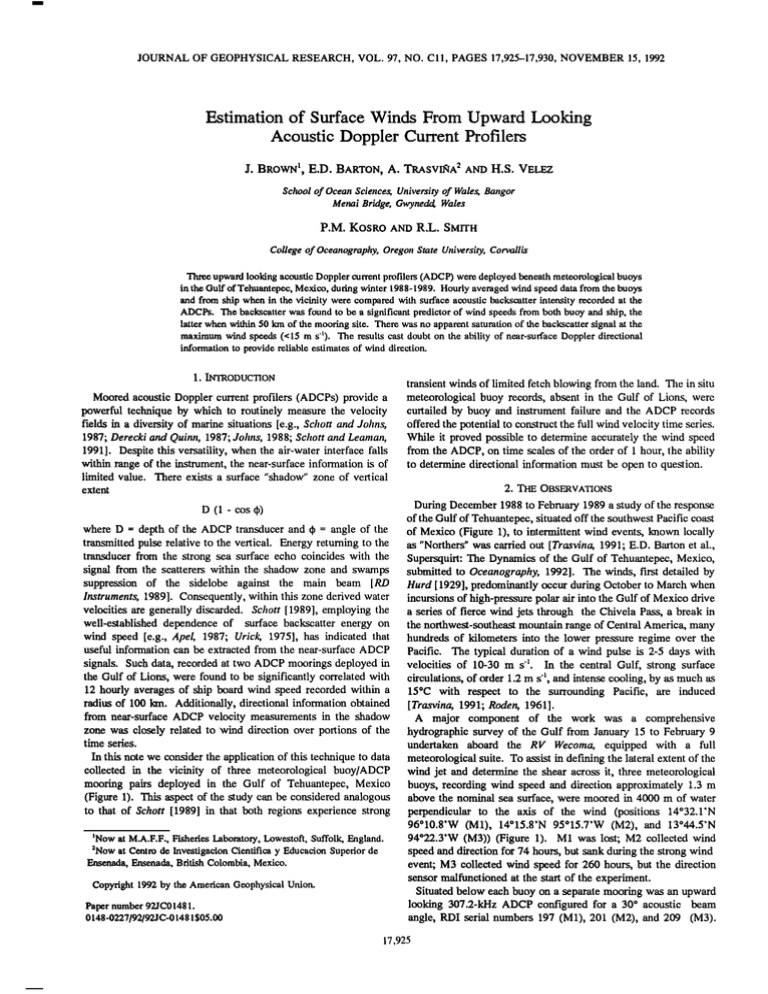
JOURNAL OF GEOPHYSICAL RESEARCH, VOL. 97, NO. Cll, PAGES 17,925-17,930, NOVEMBER 15, 1992 Estimationof SurfaceWinds From Upward Looking AcousticDoppler CurrentProfilers J. BROWN l, E.D. BARTON, A. TRASVIlqA 2 ANDH.S. VELEZ Schoolof OceanSciences,Universityof Wales,Bangor Menai Bridge,Gwynedd Wales P.M. KOSRO AND R.L. SMITH Collegeof Oceanography, OregonState University,Corvallis ThreeupwardlookingacousticDopplercurrentprofilers(ADCP) weredeployedbeneathmeteorological buoys in the Gulf of Tehuantepec,Mexico, duringwinter 1988-1989. Hourly averagedwind speeddatafrom the buoys and from ship when in the vicinity were comparedwith surfaceacousticbackscatterintensity recordedat the ADCPs. The backscatterwas found to be a significantpredictorof wind speedsfrom both buoy and ship, the latter when within 50 km of the mootingsite. There wasno apparentsaturationof the backscattersignal at the maximumwind speeds(<15 m s-t). The resultscastdoubton the abilityof near-surface Dopplerdirectional informationto providereliable estimatesof wind direction. 1. INTRODUCTION Moored acousticDoppler currentprofilers(ADCPs) providea powerful techniqueby which to routinely measurethe velocity fields in a diversityof marinesituations[e.g., Schottam:lJohns, 1987; Derecki and Quinn, 1987; Johns, 1988; Schottand Leaman, 1991]. Despitethis versatility,when the air-water interfacefalls within rangeof the instrument,the near-surfaceinformationis of limited value. transientwindsof limited fetchblowingfrom the land. The in situ meteorologicalbuoy records,absentin the Gulf of Lions, were curtailedby buoy and instrumentfailure and the ADCP records offeredthe potentialto constructthe full wind velocitytime series. While it provedpossibleto determineaccuratelythe wind speed from the ADCP, on time scalesof the orderof 1 hour, the ability to determinedirectionalinformationmustbe opento question. There exists a surface "shadow" zone of vertical 2. THE OBSERVATIONS extent D (1 - cos q>) where D -- depthof the ADCP transducerand q>= angle of the transmittedpulserelativeto the vertical. Energyreturningto the transducerfrom the strong sea surface echo coincideswith the signal from the scattererswithin the shadow zone and swamps suppressionof the sidelobe against the main beam [RD Instruments,1989]. Consequently, within this zonederivedwater velocitiesare generallydiscarded. Schott[1989], employingthe well-establisheddependenceof surfacebackscatterenergy on wind speed [e.g., Apel, 1987; Urick, 1975], has indicatedthat useful information can be extracted from the near-surface ADCP signals. Suchdata, recordedat two ADCP mooringsdeployedin the Gulf of Lions, were foundto be significantlycorrelatedwith 12 hourly averagesof ship boardwind speedrecordedwithin a radiusof 100 kin. Additionally,directionalinformationobtained from near-surfaceADCP velocity measurements in the shadow zone was closelyrelatedto wind directionover portionsof the time series. During December1988 to February1989 a studyof the response of the Gulf of Tehuantepec, situatedoff the southwestPacificcoast of Mexico (Figure 1), to intermittentwind events,known locally as "Northers"was carried out [Trasvina, 1991; E.D. Barton et al., Supersquirt:The Dynamicsof the Gulf of Tehuantepec,Mexico, submittedto Oceanography,1992]. The winds, first detailedby Hurd [ 1929], predominantlyoccurduringOctoberto March when incursionsof high-pressure polar air into the Gulf of Mexico drive a seriesof fiercewind jets through the Chivela Pass,a break in the northwest-southeast mountainrangeof CentralAmerica,many hundredsof kilometersinto the lower pressureregime over the Pacific. The typical durationof a wind pulse is 2-5 days with velocitiesof 10-30 m s-l. In the centralGulf, strongsurface circulations, of order1.2m s-l, andintense cooling,by asmuchas 15øC with respect to the surrounding Pacific, are induced [Trasvina, 1991; Roden, 1961]. A major component of the work was a comprehensive hydrographicsurveyof the Gulf from January15 to February9 undertaken aboard the R V Wecoma, equipped with a full meteorological suite. To assistin definingthe lateralextentof the wind jet and determinethe shearacrossit, three meteorological buoys,recordingwind speedand directionapproximately1.3 m In this notewe considerthe applicationof this techniqueto data collected in the vicinity of three meteorologicalbuoy/ADCP mooring pairs deployed in the Gulf of Tehuantepec,Mexico (Figure 1). This aspectof the studycan be consideredanalogous above the nominal sea surface, were moored in 4000 m of water to that of Schott [1989] in that both regions experiencestrong perpendicularto the axis of the wind (positions 14ø32.1'N 'Now at M.A.F.F.,Fisheries Laboratory, Lowestoft,Suffolk,England. :Nowat CentrodeInvestigacion Cientifica y Educacion Superior de Ensenada,Ensenada, British Colombia, Mexico. Copyright1992by the AmericanGeophysical Union. Papernumber92JC01481. 0148-0227/92/92JC-01481 $05.00 96ø10.8'W (M1), 14ø15.8'N 95ø15.7'W (M2), and 13ø44.5'N 94ø22.3'W (M3)) (Figure 1). M1 was lost; M2 collectedwind speedand directionfor 74 hours,but sankduringthe strongwind event;M3 collectedwind speedfor 260 hours,but the direction sensormalfunctioned at the startof the experiment. Situatedbeloweachbuoy on a separatemooringwas an upward looking 307.2-kHz ADCP configuredfor a 30ø acoustic beam angle, RDI serial numbers197 (M1), 201 (M2), and 209 (M3). 17,925 17,926 BROWNETAL.:UPWARD LOOKING ACOUSTIC DOPPLER CURRENT PROFILERS 100øW 21 Jan 0000 90øW • Wecoma 1989 UT i i , I i b) Met. M2 15 20ON 100 c) ADCP M2 Gulf of , Tehuantepec , , , , , , i , , , M1 e ß , I i T , , d) Met. M3 15 M2 M3 , lOON , i , ! , , i i , • 100 e) ADCP M3 ) A '= I i , , , , , , , , , , , , , , Pass km A 100 , Chivela - i 98 B f) ADCP M1 I 96 16 17 18 19 , , I , ! I , , , i • i i i I 20 21 22 23 24 25 26 27 28 29 30 31 I 2 3 Januaryto February1989 (UT) Fig. 1. Pressure regimethatgenerated theNortherof January 21-23, 1989, andtherelativepositions of themeteorological buoy/ADCP mooring pairs Fig.2. Tuneseriesof (a) shipboardwindspeedfromthe Wecoma, (b) (Nil, M2, andM3). Section(AB) illustrates the relief alongthe Sierra meteorological buoyM2 windspeed,(c)near-surface E$(dB)signalatM2, Madre del Sur. (d)meteorological buoyM3 windspeed, (e) near-surface E$(dB)signalat M3, and05 near-surface F.$(dB)signalat M 1. Therespective depths of theinstruments were135(_1), 124(_2), and 147 (+1) m, as determinedat Aanderaa RCM4 cut'rentmeters located12 m beneatheach ADCP. At the depth of the instruments, isolatedfrom the vigorouswind-generated surface flows(maximum120 cm s-1)by the strongthermocline (AT •8øC),ambientflowswereof the order10-30cm s'l, inducing minimalmooringmotion. The ADCP parameters usedwere a nominal4-m bin length,135pingsperensemble, andan ensemble time averageof 300 seconds. The onsetof northersis often dramatic,as observedat M2 on February21, whenwind speedincreased by 10 m s'• in 90 rains (Figure2b). Additionally, considerable spatialvariabilityexisted in thewindspeedfieldovertheGulf. Forexample, at thepeakof theeventlastingfromJanuary21 to 24 the Wecoma wasforcedto shelterat the headof the Gulf, resultingin distinctdifferences in shipboardspeed(Figure2a) fromthatmeasured at M3 (Figure 2d). The wind jet fansout over the Gulf as it exitsthe Chivela Pass, so that mean directions recorded within 50 km of M1 in the west and M3 in the east differed by 69ø (Table 1). It was thereforenecessarythat intercomparisons were made between instruments in closeproximity. For the purposes of thiswork, meteorological buoyandADCP pairingsweresufficientlyclose (<2 kin) to regardthemas a singlemooring,therebyenabling directcomparisons of hourlyaveraged data.Whenbuoydatawere unavailable,shipboardwind datawithin a 50-km or even20-km radius were examined. 3. WIND SPEED ESTIMATES TheADCP backscatter energy(E) mayberelatedto near-surface windspeed(U) by a powerlaw dependence of the formE ~ LP [$chott,1989], analogous to that typicallyappliedin satellite scatterometry [e.g.,Jones et aL, 1982]. Urick[1975]alsoprovides a discussion of thevariationin scattering strength frombeneath the seasurface withangle,frequency, andwindstrength, although the sound sourcesutilized were primarily nondirectional(i.e., explosives). The echo intensity,or strength(E$(dB)) of the backscattered signal,withineachbin asmeasured by theADCP is a byproduct of the automatic gaincontrol(AGC) circuitry[RD Instruments, 1989]. When calibrationdata are not available,RD Instruments suggests usinga linear scalefactor,0.46 counts/dBat 22øC,to convertAGC countsto ES(dB). Eachof the ADCPs usedin this experiment, however,had previouslybeen calibratedby RD Instrumentsto determine the variation in this scale factor with the ambient temperature of the electronics (typically,0.34%per øC [Heywood et aL, 1991])andwithsignalstrength.Thesedatawere fit to an expression of the form E$(dB)= c0 (T) + c, (T) * AGC + c2 (T) * AGC (1) wherethe coefficients %, Cl, and c2 were allowedto vary quadratically with temperature [seeFlagg alwlSmith,1989]. BROWNET AL.: UPWARD LOOKINOACOUSTICDOPPLERCURRENTPROFILERS TABLE 1. Mean Direction of Near-Surface ADCP 17,927 Data andShipWinds Within$0 km of the Moorings a) Mooring M I Mooring M2 Mooring M3 0700 I0T Jan 19 to 0100 I0T Jan lg to 0200 I0T Jan 21 to 1300 I0T Feb 4, 1989 1200 I0T Feb 2, 1991 1900 UT Feb 5, 1991 Depth, m Angle, deg Depth, m Angle, deg Depth, m Angle, deg. 5O •Surface 217 ñ 47 Surface 207 ñ 14 Surface 81 ñ 49 12.6 242 ñ 53 13.8 211 ñ 26 16.4 31 ñ 32 20.8 245 ñ 63 22.0 209 + 31 24.6 31 + 21 28.9 243 ñ 66 30.2 206 + 29 32.8 35 + 26 37.1 243ñ62 38.3 205 + 29 40.9 37 ñ 24 45.2 243 ñ 62 46.5 201 + 28 49.1 36 +_ 15 53.4 244 + 60 54.6 199 + 26 57.2 34 ñ 20 61.6 244 ñ 64 62.8 200 ñ 27 65.4 34 ñ 15 69.7 239 + 70 71.0 200 + 27 73.6 33 ñ l g Ship 230 ñ 95 Ship 191 ñ 52 Ship 161 ñ 42 ,4* 4O 0.1 1.0 10.0 100.0 90- 80 • b) 70 v CO 60 • The E$(dB) calculatedin thisway showedonly minordifferences from what would have been obtainedby using a constantscale 50 40 factor to convert the AGC; effective scale factors for M1 and M2, 30 computedfrom the regressionof AGC andES(dB), were 0.47 and 0.46, respectively. A transducerface on M3 had been replaced subsequent to calibration;thereforea value of 0.46 was assumed. Use of theseconstantscalefactorsgave estimatesof ES(dB) with 90- 0.01 80 a roughness lengthof z0= 2 * 10-nm. log,0 U = -1.31(+0.07) + 0.029(+0.001)ES(dB) (2) with a correlationcoefficientr of 0.96 (99% significancelevel is 0.76). Similarlyfor the longerrecordsat M3 (Figure3b), where r = 0.71 (99% significancelevel is 0.37). 10.00 100.00 70 v CO 60 • 50 40 30 At M2 (Figures 2b and 2c) and M3 (Figures 2d and 2e) fluctuationsin the time seriesof ES(dB) closely imitated thoseof wind speedon time scalesas shortas an hour. Consideringfirst M2, a regression of thehourlyaveragesof ES(dB)againstlog,0U (Figure3a) prior to the failureof the meteorological buoyyields log•0U = -1.24(+0.09) + 0.029(+0.001)ES(dB) I• 1.00 c) standard errors less than 1 dB. It is importantto notethat absolutecalibrationof power into the water was not known; therefore values of ES(dB) were defined relative to an arbitrary level, and intercomparisonsbetween instruments would be inappropriate. No correctionfor propagationeffectshave beenmade,but these will be minimal as vertical excursions experienced by the mooringswere minor. Additionally, the presentedwind speeds have beencorrectedto 10 m, assuminga logarithmicprofile, with 0.10 (3) Here, the considerablescatter at U < 1.0 ms-' has been excluded. At low velocities, near-surface bubble concentrationsare reduced [Wu, 1988], and it may be that surfacewave patternsplay a stronger role in regulatingthe intensityof the specularlyreflectedsurface backscatter. In addition, buoy motion may at times induce a degreeof "pumping"of the anemometer, producinganomaliesat speedscloseto the threshold. Similar analysis at M1 was precluded by the loss of the meteorologicalbuoy. A less satisfactorycomparisonwith the 0.1 1.0 10.0 100.0 (m/s) Fig. 3. Hourly values of wind speed (abscissae)versus surface echo strength(ES(dB)) (ordinates). (a) M2 with the regressionline of equation (2). (b) M3 with the regression line of equation(3) (speeds > 1.0m s'i). (c) Wecomawindswithin 50 km of M3 represented by both symbolsand the solidline of equation(4), with the datawithin 20 km givenby crosses andthe dashedline of equation(5). windsrecordedon boardthe RV Wecoma(Uw) can be made. An inspectionof the records from M2 and M3 (Figures 2b-2e), separatedby 112 km, revealsthat althoughthe main featuresare common,there are marked differences. Approachesto mooring siteswerespasmodic, rarelyfor morethan12 hoursandseparated by 2 to 5 days. The decorrelationtime [Davis, 1976] for the ES(dB) signalwas of order 1 day; thereforeeach approachcan reasonablybe regardedas 1 degree of freedom. Regressions appliedto shipdatawithin 50 km and 20 km of M 1, equations(4) and (5), respectively,yield log•0 Uw = -0.648(ñ0.143) + 0.019(ñ0.003)E$(dB) (4) 17,928 BROWN ET AL.: UPWARDLOOKINGACOUSTICDOPPLERCURRENTPROFILERS r = 0.66 (95 % significancelevel is 0.67) and log•0 Uw -- -0.869(+0.158) + 0.024(+_0.003)ES(dB) (5) r = 0.88 (99% significancelevel is 0.88). Levels of competence are reducedin comparisonwith equations(2) and (3), particularly at 50-km separation,emphasizingthe desirability of making comparisons as closeto the mooringsaspossible.In addition,the Wecomawas unableto work in the vicinity of the mooringduring strongwinds,thereforecomparisons are fmlher hamperedby the restricted rangeof wind speeds(0.0-7.4m s-•). Further,during periods of light winds the accuracyof velocities,derived by removalof the ship speedover the ground,becomeslesscertain. 4. WIND DIRECTION Here, we have adoptedthe oceanographicconventionthat the angles,measuredwith respectto truenorth,denotethe directionof travel,i.e., towardwhich air parcelsmove. Comparisonsof the near-surfaceADCP directionalinformation with that from the buoys were hamperedby the loss of M1 and the malfunctionof the vane at M3; thereforeM2 providedthe sole mooredvector-winddataset, of duration72 hours. Again, hourly averagesare considered,which in the case of the buoys were derivedfrom 6 min spotreadings. Consequently, at low speeds contaminationof the data by wave-inducedbuoy motion may consistent with the natureof the atmosphericforcingduringthe Northerseason.Regressions betweenthe curtailedbuoyrecordat M2 and the ADCP, or for ship boarddata within 50 km and the ADCPs at M1 and M2 are of little value, as in each case, directions weregenerallyconfinedwithin a sectorof lessthan90ø. The meandirections fromthe M2 buoyrecordandthe A,DCP duringthe sameperiodwere 138 + 26ø and206 + 8%respectively. This differenceof almost70ø mightbe thoughtattributable to the predominance of low windspeeds (<5 m s4) in therecord.Mean wind directions calculated for Wecoma data within 50 km of the ADCP mooringsgave betterresults. At M1, the meanshipwind directionof 230 + 95ø agreedwell with the meandirectionof 227 + 56ø indicatedby the ADCP; at M2 the shipmeanwas 191 + 52ø comparedwith the ADCP mean of 207 + 19ø. If it were not for the recordat M3 (Figure 4e), which indicates an eastwardwind, it mightreasonablybe argued,as postulatedby Schott[1989], that the near-surfaceADCP directional information provides an adequate measure of wind direction. At M3 comparisonswere limited to thosewith the Wecomadata. When within 50 km of the mooringthe meanwind directionwas 161 + 42 ø in contrast to 88 + 24 ø at the ADCP. consistent with that for the whole The ADCP series of 81 value is + 49 ø. A comparisonwith the completeWecomarecord(mean 195 + 72ø), covetingthe entire Gulf, would be inappropriate. The wind jet occur. Vector wind information was recorded on board Wecoma fansoutafterexitingthe ChivelaPass,beingsouthwestward to the west and southeastwardto the east. Manifestly, there is an every minute. Time series of wind direction recorded at M2 and aboard inconsistency betweenthe resultsat M3 and thosefrom M1 and Wecomaare presentedin Figure 4, accompaniedby the surface M2, for which insmn'nentmalfunctionseems an improbable explanation. Comparisons of direction and speed from directionalinformationderivedfrom the ADCPs. ExcludingM3, directionswere predominantlybetweensouthwestand southeast, independentmeasurementsat the Aanderaa meters situated immediatelybelow each ADCP and ship-mountedADCP data indicatedexcellentagreement. 5. DISCUSSION Evidently,near-surface wind speedandthe acousticbackscattered energy returnedto ADCPs from the sea surface are strongly correlated. In the Gulf of Lions, $chott [1989], unable to record b) Met. M2 c) ADCP M2 wind continuouslyat the ADCP moorings,was constrainedto considershipboarddatawithin a 100-km radiusandemploya 12houraveragingperiodto smoothshort-periodinconsistencies. The close proximity of the instrumentswithin the meteorological buoy/ADCPpairs duringthe Tehuantepecexperimenthas shown thatvaluescorrespondaccuratelyon time scalesof an hour. $chott[1989] citedevidencethattheechoamplitudesignalmight saturate at windspeeds exceeding 10m s-l, a featureabsent in the Tehuantepec datawheremaximumnear-surfacewind speedsat the moorings reached15 m s4. Thisdisparity mightbe attributable to the useof 30ø beamanglesin Tehuantepec, whereasin the former effective angles of 20ø and 24ø were used. For beam angles 270 relativeto the verticalof between0ø andapproximately 15ø the dominantbackscattering processis taken to be specularfrom the normallyinclinedwave facets[Urick, 1975; $chott, 1989] andthe 360 slopefactorof wind speeddependence is negative.At roughly15ø thereexistsa crossoverpoint to a positivedependence as Bragg scattering becomesincreasinglydominant.In this region,changes in scatteringstrengthbecome progressivelyless sensitiveto 0 increasesin wind speed. 16 17 18 19 20 21 22 23 24 25 26 27 28 29 30 31 I 2 3 Upward lookingADCPs offer the potentialto determinelocal January to February1989 (UT) surfacewind stresswithout additionalexpensiveand vulnerable surfaceinstrumentation or recourseto ship board or land-based Fig. 4. Direction time series,following the conventionthat the angle is data that often fail to truly representconditionsat surveysites. relativeto true north and toward the directionof flow. (a) Wecoma, (b) can be regardedas replacements for wind meteorologicalbuoy M2, (e) near-surfaceADCP at M2, (d) near-surface Beforethe instruments ADCP at M 1, and (e) near-surfaceADCP at M3. buoys, questionsremain to be answered. For instance;Are 0 , , i , , i i , , , , , , t , i , • , BROWNET AL.: UPWARD LOOKINGACOUSTICDOPPLERCURRENTPROFILERS laboratorycalibrations of transducer gainsstable?How predictable aredepthdependencies dueto spreading, scattering, andabsorption which will affect interpretationfrom separatedeploymentsof an instrument?Is therea fetchdependence? Doesthe natureof the seasurfacelayervarysignificantlywith meteorological conditions? Comparisonsof near-surfaceADCP directionalinformationwith ship board wind directions proved less satisfactory. An explanation may be foundfrom an examinationof the near-surface ADCP data (Table 1). During the observationalperiod the directionof the flows in the surfacelayer at the western(M 1) and central(M2) mooringswas predominantly southwestward.At the easternmooring (M3) there existed a persistentnortheastward return flow toward the head of the Gulf. Thus, at M1 and M2, currentswere essentiallyin the samedirectionas the wind, while 17,929 evidentthat currentdirectionwas similarthroughout the upper layersand essentiallyopposedto Wecornawind (separation< 50 km) direction, while the surface bin direction varied between the two. This seemsreasonable, asthe Dopplershift measuredat the ADCP is a power-averaged meanof thosegenerated by advancing and retreatingsurfacewavesand the velocityof scattererswithin the water column,the latter being additionallyadvectedby the mean flow lapel, 1987]. Duringthe periodsof consideration, in both the Gulfs of Lions [Schott,1989] and Tehuantepee, circulationwas primarilywind driven. The experimentsdiffered in that in the latter, an ADCP (M3) was situatedin a regionforcedindirectlywhere circulation persistentlyopposedthe wind direction. Indeed, Schott [1989] discarded severalperiodsof strongbarotropic flowsextendinginto thesurfacezonewhencurrentsclearlyopposed the winddirection. It may be that undera more diversecurrentregimehis findings might have differed. In conclusion,the presentdata set showsthat the near-surface backscattered energy recordedat the ADCP providesa good measureof wind speed,on time scalesof an hourwith apparently no saturationof the ES(dB) signalat higherwind speeds. The considerationto M3, where the ADCP surfacebin direction falls Dopplerdataagreed roughlymidway (mean 81ø) betweenthe mean wind direction directionalinformationfrom the near-surface with the observed wind direction only where the underlyingcurrent derivedfrom the Wecornawhen within 50 km of the mooring at M3 theywere in oppositionto the dominantwind direction. Considering only M1 andM2, onemightconcludefromthe close agreementin the ship wind and surfacebin directionsthat the near-surface ADCP directionalinformationwas representative of wind direction. Equally, it could be concludedthat it was indicative of near-surfacecurrent direction. Extending (at 20 m) was in nearlythe samedirectionas the wind. At the site where the directionsof the underlyingcurrentand wind differed some combination of the current and wind. Consideration of data by almost 120ø, the near-surfaceDoppler data indicated an when Wecornaand M3 are in closerproximity(25 km) produces intermediatedirection. This castsdoubt on the ability of the to providereliable estimatesof the wind little change,with meansof 159øand87ø, respectively.Excluding Dopplermeasurements (mean 160ø) and the currentdirection(mean ~ 32ø) (Table 1), it is reasonable to concludethat the near-surface signalis in fact periodsof weak winds (<3 m s-•), when directionsmight be expectedto be variable,yields the sameresults. The ADCP time seriesis illustratedin (Figure 5), where it is Wecoma 10 direction. Acknowledgements.UCNW funding was provided by the Natural EnvironmentalResearchCouncil(grantGR3/6719) and for OSU by the Office of Naval Research(contractN00014-87-K-0009;grantN00014-90J-1177). Thanks are also due to all those who contributed to the Tehuantepecproject. wind REFERENCES E Apel, J.R., Principlesof OceanPitysics,lnt. Geophys.Set'..vol. 38, 534 pp., Academic, San Diego, Calif., 1987. Davis, R.E., Predictabilityof sea surfacetemperatureand sea level pressure anomaliesoverthe NorthPacificOcean,J. Phys.Oceanogr.,6, -10 Surface 120 249-266, 1976. Derecki, J.A., and F.H. Quinn, Use of current meteta for continuous measurementsof flows in large rivers, Water Resour. Res., 23, 1751-1756, 1987. o Flagg,C.N. and S.L. Smith, On the useof the acousticDopplercun'ent profilerto measurezooplankton abundance, DeepSeaRes.,36, 455-474, -120 16.4 120 1989. m Heywood, K.J., S. Scrope-Howe, and E.D. Barton, Estimation of zooplanktonabundancefrom shipborneADCP backscatter,Deep Sea Res., 38, 677-691, 1991. -121 73.6 120 Hurd, W.E., Northernof the Gulf of Tehuantepec,Mon. WeatherRev.,57, 192-194, 1929. Johns,W.E., Near-surface currentmeasurements in theGulf Streamusing an upward-lookingacousticDopplercurrentprofiler,d. Atmos.Oceanic m Technol., 5, 602-613, 1988. Jones,W.L., L.C. Schroeder,D.H. Boggs,E.M. Bracalente,R.A. Brown, G.J. Dome, W.J. Pierson, and F.J. Wentz, o -120 i i i i i i 15 20 25 30 35 40 Time (UT) Julian Days 1989 Fig. 5. Horizontalcurrentvector time seriesat M3 with Wecomawinds when within 50 km of the mooring. The Seasat A satellite scatterometer:The geophysicalevaluation of remotely sensedwind vectorsover the ocean,J. Geophys.Res.,87, 3297-3317, 1982. RD Instruments, Acoustic Doppler Current Profilers principles of operation:A practicalprimer, 36 pp., San Diego, Calif., 1989. Roden,G.I., On the wind drivencirculationin the Gulf of Tehuantepec and its effectuponsurfacetemperatures, Geofis.Int., 1, 55-80, 1961. Schott,F., Measuringwinds from undemeaththe oceansurfaceby upwardlookingacousticDopplercurrentprofilers,J. Geophys.Res.,94, 8313-8321, 1989. 17,930 BROWN ETAL.:UPWARD LOOKING ACOUSTIC DOPPLER CURRENT PROFILERS Schott,F., andW. Johns,Haft-yearlongmeasurements witha buoymounted AcousticDopplerCurrentProfilerin the SomaliCurrent,J. Geophys. Res.,92,5169-5176, 1987. Schott, F.,andK.D. Leaman,Observati • withmoored acoustic Doppler currentprofilersin the convectionregimeof the Guff of Lions,J. Phys. Oceanogr.,21,558-574, 1991. Tm.veina,A., Offshorewind forcingin a coastalocean:observations and modelingof the Guff of Tehuantepec,Mexico, Ph.D. Thesis,88 pp., Universityof Wales, 1991. Urick, P,.J., Principlesof Ut•lerwater Sound,2nd ed., 384 pp., McGrawHill, New York, 1975. Wu, J., Bubbles in the near-surface ocean: A general description,J. Geophys.Res., 93, 587-590, 1988. E.D.BartOn 'and H.S.Velez, School ofOcean Sciences, University of Wales,Bangor,Menai Bridge,Owynedd,LI.59//EY, Wales. J. Brown,M.A.F.F., FisheriesLaboratory,Lowestoft,Suffolk,NR33 0HT, England. P.M. Kosro and R.L. Smith, College of Oceanography, OregonState Univemity, Corvallis, Oregon 97331. A. Trasvina,Centrode InvestigacionCienti•lcay EducacionSuperiorde œnsenada,Ensenada,British Colombia, Mexico. (ReceivedJanuary27, 1992; acceptedMarch 30, 1992.)
![RV_Samudrika_OCD[1] - National Aquatic Resources](http://s3.studylib.net/store/data/006800414_1-43b0de77fff9015425fb10ff885be924-300x300.png)
