Document 13180851
advertisement
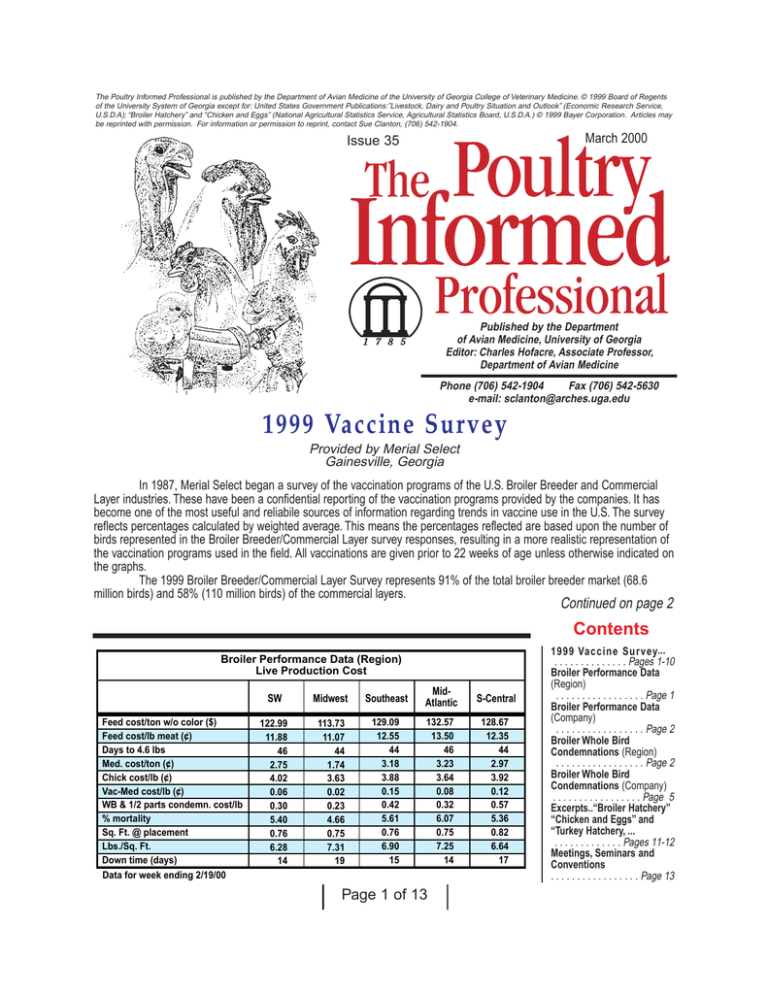
The Poultry Informed Professional is published by the Department of Avian Medicine of the University of Georgia College of Veterinary Medicine. © 1999 Board of Regents of the University System of Georgia except for: United States Government Publications:”Livestock, Dairy and Poultry Situation and Outlook” (Economic Research Service, U.S.D.A); “Broiler Hatchery” and “Chicken and Eggs” (National Agricultural Statistics Service, Agricultural Statistics Board, U.S.D.A.) © 1999 Bayer Corporation. Articles may be reprinted with permission. For information or permission to reprint, contact Sue Clanton, (706) 542-1904. March 2000 Issue 35 Published by the Department of Avian Medicine, University of Georgia Editor: Charles Hofacre, Associate Professor, Department of Avian Medicine Phone (706) 542-1904 Fax (706) 542-5630 e-mail: sclanton@arches.uga.edu 1999 Vaccine Survey Provided by Merial Select Gainesville, Georgia In 1987, Merial Select began a survey of the vaccination programs of the U.S. Broiler Breeder and Commercial Layer industries. These have been a confidential reporting of the vaccination programs provided by the companies. It has become one of the most useful and reliabile sources of information regarding trends in vaccine use in the U.S. The survey reflects percentages calculated by weighted average. This means the percentages reflected are based upon the number of birds represented in the Broiler Breeder/Commercial Layer survey responses, resulting in a more realistic representation of the vaccination programs used in the field. All vaccinations are given prior to 22 weeks of age unless otherwise indicated on the graphs. The 1999 Broiler Breeder/Commercial Layer Survey represents 91% of the total broiler breeder market (68.6 million birds) and 58% (110 million birds) of the commercial layers. Continued on page 2 Contents Broiler Performance Data (Region) Live Production Cost Feed cost/ton w/o color ($) Feed cost/lb meat (¢) Days to 4.6 lbs Med. cost/ton (¢) Chick cost/lb (¢) Vac-Med cost/lb (¢) WB & 1/2 parts condemn. cost/lb % mortality Sq. Ft. @ placement Lbs./Sq. Ft. Down time (days) SW Midwest Southeast MidAtlantic S-Central 122.99• 11.88• 46• 2.75• 4.02• 0.06• 0.30• 5.40• 0.76• 6.28• 14 113.73• 11.07• 44• 1.74• 3.63• 0.02• 0.23• 4.66• 0.75• 7.31• 19 129.09• 12.55• 44• 3.18• 3.88• 0.15• 0.42• 5.61• 0.76• 6.90• 15 132.57• 13.50• 46• 3.23• 3.64• 0.08• 0.32• 6.07• 0.75• 7.25• 14 128.67• 12.35• 44• 2.97• 3.92• 0.12• 0.57• 5.36• 0.82• 6.64• 17 Data for week ending 2/19/00 Page 1 of 13 1999 Vaccine Survey... . . . . . . . . . . . . . . Pages 1-10 Broiler Performance Data (Region) . . . . . . . . . . . . . . . . . Page 1 Broiler Performance Data (Company) . . . . . . . . . . . . . . . . . Page 2 Broiler Whole Bird Condemnations (Region) . . . . . . . . . . . . . . . . . Page 2 Broiler Whole Bird Condemnations (Company) . . . . . . . . . . . . . . . . . Page 5 Excerpts..“Broiler Hatchery” “Chicken and Eggs” and “Turkey Hatchery, ... . . . . . . . . . . . . . Pages 11-12 Meetings, Seminars and Conventions . . . . . . . . . . . . . . . . . Page 13 1999 Vaccine Survey Continued from page 1 BROILER BREEDER VACCINE SURVEY One Time SB-1 Marek’s HVT Two Times Three Times Four Times 37% Five Times 63% 100% Over Five Times Not Using No Yes HVT/Rispens* Rispens HVT/SB-1Rispens* 9% 31% 69% 40% 60% 91% * 40% Rispens use broken out into smaller combo graphs Broiler Performance Data (Company) Live Production Cost Feed cost/ton w/o color ($) Feed cost/lb meat (¢) Days to 4.6 lbs Med. cost/ton (¢) Chick cost/lb (¢) Vac-Med cost/lb (¢) WB & 1/2 parts condemn. cost/lb % mortality Sq. Ft. @ placement Lbs./Sq. Ft. Down time (days) Average Co. Top 25% Top 5 Cos. 142.94 120.63 114.24 12.39 45 2.95 3.95 0.09 11.37 45 2.36 3.75 0.04 11.31 46 2.09 3.00 0.03 0.39 0.23 0.32 5.44 0.77• 6.68• 15 4.32 0.76 6.60 18 3.85 0.80 7.18 21 Data for week ending 2/19/00 Continued on page 3 Broiler Whole Bird Condemnation (Region) % Septox % Airsac % I.P. % Leukosis % Bruise % Other % Total % 1/2 parts condemnations SW MidWest S. MidS. East Atlantic Central 0.431• 0.177• 0.094• 0.008• 0.010• 0.024• 0.743• 0.408• 0.078• 0.061• 0.003• 0.008• 0.006• 0.565• 0.313• 0.540• 0.246• 0.013• 0.029• 0.025• 1.181• 0.449• 0.245• 0.135• 0.014• 0.015• 0.040• 0.880• 0.417• 1.045• 0.339• 0.003• 0.016• 0.025• 1.846• 0.457 0.339 0.502 0.421 0.448 Data for week ending 2/19/00 Page 2 of 13 1999 Vaccine Survey Continued from page 2 Live Newcastle One Time Two Times 12% Three Times Four Times Inactivated Newcastle 1% 1% 51% 64% Five Times 48% 23% Over Five Times Not Using No Yes Live Newcastle Boost Live Infectious Bronchitis 37% 28% 82% 6% 13% 18% Inactivated Infectious Bronchitis 2% 10% 43% 61% During Lay Live Infectious Bronchitis Boost Inactivated Infectious BursalStandard 18% 82% Inactivated Infectious Bursal Variant 4% 96% 4% 96% During Lay 68.6 million birds represented in each graph. Page 3 of 13 Continued on page 4 1999 Vaccine Survey Continued from page 3 Inactivated Infectious Bursal Reo One Time Live Infectious Bursal Standard 1% Two Times 1% Three Times 40% 13% Four Times 29% Five Times 87% 29% Over Five Times Not Using Mid Lay No Yes Live Infectious Bursal Variant 13% Live Reo 3% Inactivated Reo 10% 5% 3% 37% 55% 47% 35% Avian Encephalomyelitis and Fowl Pox 92% Infectious Laryngotracheitis AE/Pox Combo Only 23% 64% 25% AE/Pox + Pox 5% AE/Pox + AE 3% AE + Pox 5% 75% Other Combinations 68.6 million birds represented in each graph. Page 4 of 13 Continued on page 5 1999 Vaccine Survey Continued from page 4 Live Coccidiosis One Time Live CAV Two Times Three Times 33% Four Times Five Times 37% 67% 63% Over Five Times Not Using No Yes Live and Inactivated Cholera 5% 2% 18% Two Live Two Live Two Live + One Killed Two Live + One Killed Other Combinations Other Combinations 40% 29% 6% 68.6 million birds represented in each graph. Continued on page 6 Broiler Whole Bird Condemnation (Company) % Septox % Airsac % I.P. % Leukosis % Bruise % Other % Total % 1/2 parts condemnations Average Co. Top 25% Top 5 Co.'s 0.422• 0.479• 0.189• 0.012• 0.018• 0.024• 1.142• 0.423 0.339• 0.141• 0.064• 0.006• 0.012• 0.011• 0.574• 0.338 0.555• 0.295• 0.049• 0.011• 0.011• 0.000• 0.921• 0.353 Data for week ending 2/19/00 The University of Georgia is committed to the principle of affirmative action and shall not discriminate against otherwise qualified persons on the basis of race, color, religion, national origin, sex, age, physical or mental handicap, disability, or veteran’s status in its recruitment, admissions, employment, facility and program accessibility, or services. The Poultry Informed Professional Newsletter is published with support from Bayer Corporation Page 5 of 13 1999 Vaccine Survey Continued from page 5 BROILER/BREEDER SURVEY COMPARISONS One Time Two Times Three Times Four Times Five Times Over Five Times Not Using No Yes Vaccine Used 1997 1999 Percentage Variance Marek’s Rispens 0% 40% +40% 20% 66% 23% 64% +3% -2% 19% 60% 11% 10% 10% 43% 28% 19% -9% -17% +17% +9% 52% 8% 47% 13% -5% +5% Yes 18% 13% -5% Live AE/Pox Combo AE/Pox + Pox AE/Pox + AE 50% 33% 4% 64% 23% 5% +14% -10% +1% 57% 41% 48% 51% -9% +10% 76% 21% 61% 37% -15% +16% 82% 18% +19% -19% 9% 88% 5% 92% -4% +4% 59% 41% 67% 33% +8% -8% Live Newcastle Two Times Three Times Live Bronchitis Two Times Three Times Four Times Over Five Times Live IBD (Variant) Not Using Two Times Inactivated Mid-Lay Boost Bursal/Reo Inactivated Newcastle Not Using One Time Inactivated Bronchitis Not Using One Time Live Newcastle Boost During Lay 63% Not Using 37% Using Inactivated Reovirus Not Using Two Times Live Coccidiosis Using Not Using Continued on page 7 Page 6 of 13 1999 Vaccine Survey Continued from page 6 COMMERCIAL LAYER VACCINE SURVEY Marek’s HVT One Time Marek’s SB-1 2% Two Times Three Times Four Times Five Times 100% 98% Over Five Times Not Using No Yes Rispens Live Newcastle Inactivated Newcastle 7% 21% 18% 42% 58% Live Newcastle Boost 75% 79% Live Infectious Bronchitis Inactivated Infectious Bronchitis 17% 7% 26% 21% 9% 74% 67% 79% During Lay 110 million birds represented in each graph. Page 7 of 13 Continued on page 8 1999 Vaccine Survey Continued from page 7 Live Infectious Bronchitis Boost One Time Two Times Live Infectious Bursal Standard 7% Three Times 11% 29% Four Times 12% Five Times Over Five Times 39% 31% 71% Not Using No During Lay Yes Live Infectious Bursal Variant Avian Encephalomyelitis and Fowl Pox 5% 9% 20% 27% 86% 4% 2% 14% 33% AE/Pox +Fowl Pox* AE/Pox Combo Only Not Using AE/Pox + AE* AE + Pigeon or Fowl Pox* AE/Pox + Pigeon Pox* * Use of multi-antigens at differing ages Competitive Exclusion (CE) Coryza Inactivated Infectious Laryngotracheitis 1% 1% 1% 15% 41% 16% 98% 98% 99% 98% 28% 110 million birds represented in each graph. Continued on page 9 Page 8 of 13 1999 Vaccine Survey Continued from page 8 One Time Two Times Three Times Four Times Five Times Live Salmonella Over Five Times Inactivated Salmonella 1% 1% Not Using 17% No Yes 98% 99% Live MG 82% Inactivated MG 4% 1% 40% 98% 99% 56% Live Coccidiosis Inactivated MS 8% 1% 92% 98% 99% 110 million birds represented in each graph. Continued on page 10 Page 9 of 13 1999 Vaccine Survey Continued from page 9 COMMERCIAL LAYER SURVEY COMPARISONS Vaccine Used 1997 1999 Percentage Variance Two Times Marek’s Rispens 42% 58% +16% Three Times Live Newcastle 3% 29% 66% 7% 18% 75% +4% -11% +9% 3% 53% 12% 7% 67% 9% +4% +14% -3% 86% 14% 79% 21% -7% +7% 86% 14% 79% 21% -7% +7% 1% 7% 57% 16% 19% 7% 12% 31% 39% 11% +6% +5% -26% +23% -8% 16% 41% 28% 15% +1% +15% -31% +15% 56% 40% 4% 0% +3% -3% 1% -5% 8% +8% One Time Four Times Five Times Over Five Times Not Using No Yes Two Times Three Times Four Times Live Bronchitis Two Times Four Times Five Times Inactivated Newcastle Not Using Using Inactivated Bronchitis Not Using Using Live IBD (Standard) Not Using One Time Two Times Three Times Four Times Infectious Laryngotrachetitis Not Using 15% One Time 26% 59% Two Times 0% Three Times Live MG Using 56% One Time 37% 7% Two Times Inactivated MG Using 6%(1995) Inactivated MS -% Using Page 10 of 13 Excerpts from the latest USDA National Agricultural Statistics Service (NASS) “Broiler Hatchery,” “Chicken and Eggs” and “Turkey Hatchery” Reports and Economic Research Service (ERS) “Livestock, Dairy Broiler Producers’ Returns Remain Positive According to the latest Economic Research Service (ERS) report, despite broiler price declines in 1999, returns have remained positive and have encouraged further expansion. Broiler production in 2000 is likely to expand an additional 4-5 percent as returns are expected to remain positive, although at lower levels than in 1998 and 1999. The number of birds available to enter the hatchery supply flock points to a continued expansion of the broiler supply flock in first-half 2000. Egg sets were above a year ago from mid-December through mid-February, after dipping below a year ago in late 1999. and Poultry Situation and Outlook” Reports Rising exports to Asia and a slowly recovering export market in Russia are expected to partially offset the downward pressure on parts prices from increasing production. In the second half of 2000, broiler prices are expected to benefit from gradually rising prices for beef and pork. U.S. broiler exports are expected to increase to 4.8 billion pounds in 2000, after reaching 4.7 billion pounds in 1999, up 1.5 percent. While broiler exports have grown somewhat in volume, they have declined in value as unit prices for most parts have fallen. Russian poultry import demand in 2000 is expected to be somewhat higher, but still well below the record levels of 1997. Also, regulations barring imports into Russia through the Baltic nations, if enacted, could temporarily disrupt trade. Continued growth in exports to Hong Kong/China and other Asian markets are expected to help offset the slow growth in the Russian market. While Asian demand is expected to increase in 2000, the rate of growth to these markets is expected to be considerably lower than in 1999. Shipments in 1999 were stronger than anticipated, chiefly due to the large increase in shipments to the Hong Kong/China market. in 1999 exports to this market were up over 25 percent to 1.4 billion pounds. The strong gains to the Hong Kong/China market and increased exports to the Baltic countries, Korea, and Japan helped offset the large decline in shipments to Poland and direct shipments to Russia. Turkey Production To Increase Turkey production in 2000 is expected to reach 5.3 billion pounds, 2 percent higher than in 1999, but still below production in 1996 and 1997. Turkey production posted year-over-year increases in the last three quarters of 1999 and with prices expected to be stable in 2000, the expansion is expected to continue throughout 2000. Turkey exports in 2000 are forecast to be approximately 390 million pounds, up slightly from 1999, but well below the record shipments of over 600 million pounds in 1997. Higher growth in exports to several Asian countries such as Taiwan, Korea and Japan is expected to offset lower shipments to places such as Mexico and Hong Kong. Also last year’s large drop in exports to Russia and Poland is not expected to be repeated in 2000. Again the chief determinant of exports will be demand from the Mexican processed product sector, as a large percentage of U.S. turkey exports to Mexico are combined with other meats and used in the sausage market. Turkey exports over the last quarter of 1999 were 118 million pounds, up over 5 million pounds from the previous year. Turkey exports gained strength in the fourth quarter as shipments to Mexico, the largest market, have picked up. Even with stronger shipments in the fourth quarter, 1999 exports to Mexico were down 13 percent and are a primary factor in 1999’s lower turkey exports, Canada continues to be one of the strongest growth markets, with shipments up 36 percent in 1999. Egg Production To Rise Egg production in 2000 is expected to reach 7.1 billion dozen with increases forecast for both table and hatching eggs. Egg returns were positive in 1999 and supported the increasing production. However, the higher production and a lackluster export market have put downward pressure on egg prices. Prices in 1999 were down 13 percent form the previous year and down for the third consecutive year. Prices in 2000 are again expected to decline, falling about a nickel from the previous year, to around 60 cents. Total egg exports (shell eggs and the shell egg equivalent of egg products) in 2000 are expected to total 170 million dozen, up 8 percent from 1999. Exports are expected to rebound in 2000 following steep declines in 1999 due to lower exports of shell eggs to Hong Kong and egg products to Mexico. Exports of hatching eggs are expected to continue to expand, especially to markets in Central America. Page 11 of 13 January Egg Production Up 2 Percent The latest National Agricultural Statistics (NASS) reports U.S. egg production totaled 7.15 billion during January 2000, up 2 percent from the 6.98 billion produced in 1999. Production included 6.06 billion table eggs and 1.09 billion hatching eggs, of which 1.02 billion were broiler-type and 65.0 million were egg-type. The total number of layers during January 2000 averaged 329 million, up 2 percent from the total average number of layers during January 1999. January egg production per 100 layers was 2,176 eggs, up 1 percent from 2,165 eggs in January 1999. All layers in the U.S. on February 1, 2000 totaled 329 million, up 2 percent from a year ago. The 329 million layers consisted of 270 million layers producing table or commercial type eggs, 56.0 million layers producing broiler-type hatching eggs, and 2.69 million layers producing egg-type hatching eggs. Rate of lay per day on February 1, 2000, averaged 69.0 eggs per 100 layers, down slighlty from the 69.1 a year ago. Laying flocks in the 30 major egg producing States produced 6.72 billion eggs during January, up 2 percent from January 1999. The average number of layers during January, at 309 million, was up 2 percent from a year earlier. Egg-Type Chicks Hatched Down 4 Percent Egg-type chicks hatched during January totaled 34.1 million, down 4 percent from January 1999. Eggs in incubators totaled 32.8 million on February 1, 2000, down 3 percent from a year ago. Domestic placements of egg-type pullet chicks for future hatchery supply flocks by leading breeders totaled 212,000 during January 2000, up 28 percent from January 1999. Broiler Hatch Up 2 Percent The January 2000 hatch of broiler-type chicks, at 749 million, was up 2 percent from January of the previous year. There were 620 million eggs in incubators on February 1, 2000, up 2 percent from a year earlier. Leading breeders placed 6.86 million broiler-type pullet chicks for future domestic hatchery supply flocks during January 2000, down 3 percent from January 1999. Broiler Eggs Set In 15 Selected States Up 1 Percent Commercial hatcheries in the 15-State weekly program set in incubators 183 million eggs during the week ending February 26, 2000. This was up 1 percent from the eggs set the corresponding week a year earlier. Average hatchability for chicks hatched during the week was 82 percent. Average hatchability is calculated by dividing chicks hatched during the week by eggs set three weeks earlier. Broiler Chicks Placed Down 1 Percent Broiler growers in the 15-State weekly program placed 141 million chicks for meat production during the week ending February 26, 2000. Placements were down 1 percent from the comparable week in 1999. Cumulative placements from January 2, 2000, through February 26, 2000, were 1.15 billion, up 2 percent from the same period a year earlier. Turkey Eggs in Incubators on February 1 Down 1 Percent From Last Year Turkey eggs in incubators on February 1, 2000, in the United States totaled 30.8 million, down 1 percent from February 1 a year ago. Eggs in incubators were down 2 percent from the January 1 total of 31.5 million. Regional changes from the previous year were: East North Central, up 3 percent; West North Central, down 1 percent; North and South Atlantic, down 2 percent; South Central, up 1 percent; and West, down 8 percent. Poults Placed During January Up 1 Percent The 24.8 million poults placed during January 2000 in the United States were up 1 percent from the number placed during the same month a year ago. Placements were down 3 percent from the December total of 25.5 million. Regional changes from the previous year were: East North Central, up 2 percent; West North Central, up 1 percent; North and South Atlantic, up 1 percent; South Central, down 2 percent; and West, unchanged. Page 12 of 13 Meetings, Seminars and Conventions 2000 March March 14-15: Feed Mill Management Seminar, Nashville, Tenn. Contact: U.S. Poultry & Egg Association, 1530 Cooledge Road, Tucker, Ga. 30094. Phone: 770-493-9401. March 15-16: 29th Annual Midwest Poultry Federation Convention, RiverCentre, St. Paul, MN. Contact: Laura Ginsburg at 651-646-4553; Fax: 651-646-4554. March 22-23: New England Poultry Health Conference, Sheraton Hotel, Portsmouth, NY; William Bell, William Bell Assoc., Inc., P.O. Box 725, Augusta, Maine 04330 March 22-23: WPSA (UK Branch), Poultry Science Spring Meeting, Scarborough, UK. Contact: Dr. Paul Rose, Harper Adams University College, Newport, Shropshire TF10 8NB, UK. Fax: +4 (0) 1952 815217 March 29-30: Nebraska Poultry Industries Annual Convention, New World Inn, Highway 30 and 81 South, Columbus, NE. Contact: Nebraska Poultry Industries, Inc., A103 Animal Sciences, University of Nebraska, P.O. Box 830908, Lincoln, NE 63583-0908. Phone: 403-472-2051. 2000 April April 5-7: Food Irradiation 2000, “A food safety process for the new millennium”, will be held at the Sheraton National Hotel in Arlington, Virginia (Washington DC). Contact: Deborah Crommett, Conference Co-ordinator, Intertech Conferences, 411 US Route One, Portland, Maine 04105 USA, Fax + (207) 781-2150. April 12-13: Poultry Industry Exhibition, Western Fairgrounds, London, ON. Sponsored by the Ontario Poultry Industry Council. Contact Phone: (519) 837-0284; Fax: (519) 837-3584; e-mail: pic@easynet.ca April 13-16: Georgia Poultry Federation Annual Spring Meeting, Callaway Gardens, Pine Mountain, GA. Details from Georgia Poultry Federation, P.O. Box 763, Gainsville, GA 30503. Phone 770-532-0473. April 18-21: VIV China, International Trade Fair for Intensive Animal Production and Processing. Contact: Mr. Richard de Boer, Product Manager VIV Royal Dutch Jaarbeurs, PO Box 8500, 3503 RM Utecht, The Netherlands, Fax: +31 30 295 5709. 2000 May May4-5: National Breeders Roundtable, St. Louis, Mo. Contact: U.S. Poultry & Egg Assoc., 1530 Cooledge Road, Tucker, GA 30094. Phone: 770-493-9401. May10-12: Avicola 2000, The Second International PoultryExhibition and Conference. Predio Ferial de Palemo, Buenos Aires, Argentina. Contact: Sr. Diego Forte, EJ Krause y Asociados, Av de Mayo 605, 40 piso (1084) Buenos Aires,Argentina. Fax: + 54-14343-4833. May 19-20: Kentucky/Tennessee Poultry Meeting, Bowling Green, Ky. Contact: Carole Knoblett, Kentucky Poultry Federation, P.O. Box 21829, Lexington, Ky. 40522-1829. Phone: 606-266-8375. May 20: GPF Night of Knights, Cobb Galleria Center, Atlanta, GA. Contact: Georgia Poultry Federation, P.O. Box 763, Gainsville, GA 30503. Phone: 770-532-0473. 2000 June June 1-3: AP&EA Convention, Birmingham, AL. Contact: Alabama Poultry & Egg Association, P.O. Box 240, Montgomery, AL 36101-0240. Phone: 334-265-2732 June 2-3: Georgia Veterinary Medical Assn. Poultry Program, The Resort at Sandestin, Destin, Florida. Contact: GVMA 770-416-1633 or Fax: 770-416-9095. E-Mail: gvma@mindspring.com June 9-10: Ark. Poultry Festival, Arlington Hotel, Hot Springs, Ark. Contact: Judy Kimbrell, Poultry Federation, P.O. Box 1446, Little Rock, Ark. 72203. Phone: 501-375-8131 June 9-10: Delmarva Chicken Festival, Historic Downtown Berlin, Maryland. Contact: Connie Parvis, Page 13 of 13 Delmarva Poultry Industry, INc. R.D.G., P.O. Box 47, Georgetown, DE 199479575. Phone: 302-856-9037. Fax: 302-856-1845. 2000 July July 2-6: Xth International Congress on Animal Hygiene, Maastricht, The Netherlands. Contact: Royal Netherlands Veterinary Association, P.O. Box 14031, NL-3508 SB Utrecht, The Netherlands. Fax: +31 30 251 1787 July 6-14: XXth Gala International Symposium/Workshop on Rapid Methods and Automation in Microbiology. Manhattan, Kansas, Contact: Daniel Y.O. Fung, Kansas State University, Manhattan, KS 66506-1600. Phone: 785-532-5654; Fax: 785-5325681; dfung@oz.oznet.ksu.edu: http://www.dec.ksu.edu/dec/con/microciology July 22-26: AVMA 137th Annual Convention, Salt Lake City, Utah. Contact: American Veterinary Association, 1931 North Meacham Road, Schaumburg, IL 60173. Phone: 847-925-8070, Fax: 847-925-1329. 2000 August Aug. 20-25: XXI World’s Poultry Congress, Convention Centre, Montreal, Quebec. Contact: Rosaleen Rinzler, WPC 2000 Congress Secretariat, Events International Meeting Planners Inc., 759 Victoria Square, Suite 300, Montreal, Quebec, Canada H2Y 2J7. Phone: 514-286-0855. 2000 November Nov. 27: Coccidiosis 2000, Hannover, Germany. Contact: Elaine Robson, Conference Organizer, Positive Action Conferences, P.O. Box 4, Driffield, East Yorkshire Y025 9D1 England. Phone: +44 (0) 1377-256316; Fax: +44 (0) 1377-254663.
