College Portrait
advertisement
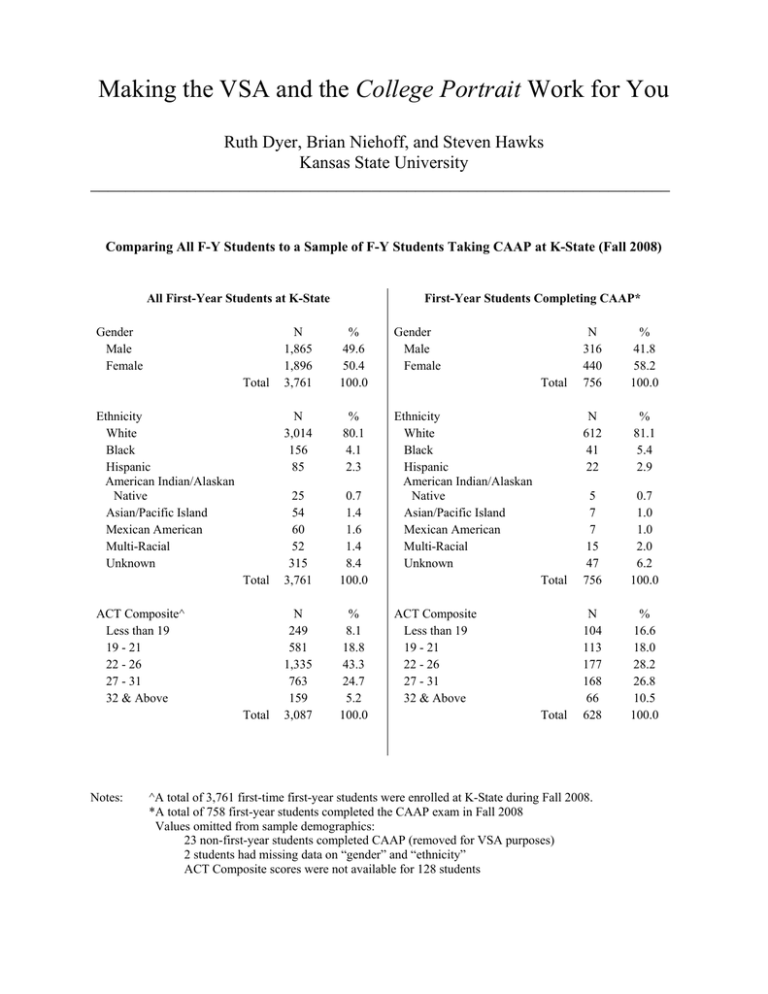
Making the VSA and the College Portrait Work for You Ruth Dyer, Brian Niehoff, and Steven Hawks Kansas State University __________________________________________________________________ Comparing All F-Y Students to a Sample of F-Y Students Taking CAAP at K-State (Fall 2008) All First-Year Students at K-State Gender Male Female N 1,865 1,896 3,761 % 49.6 50.4 100.0 Gender Male Female N 3,014 156 85 % 80.1 4.1 2.3 Total 25 54 60 52 315 3,761 0.7 1.4 1.6 1.4 8.4 100.0 Ethnicity White Black Hispanic American Indian/Alaskan Native Asian/Pacific Island Mexican American Multi-Racial Unknown Total N 249 581 1,335 763 159 3,087 % 8.1 18.8 43.3 24.7 5.2 100.0 Total Ethnicity White Black Hispanic American Indian/Alaskan Native Asian/Pacific Island Mexican American Multi-Racial Unknown ACT Composite^ Less than 19 19 - 21 22 - 26 27 - 31 32 & Above Notes: First-Year Students Completing CAAP* N 316 440 756 % 41.8 58.2 100.0 N 612 41 22 % 81.1 5.4 2.9 Total 5 7 7 15 47 756 0.7 1.0 1.0 2.0 6.2 100.0 Total N 104 113 177 168 66 628 % 16.6 18.0 28.2 26.8 10.5 100.0 Total ACT Composite Less than 19 19 - 21 22 - 26 27 - 31 32 & Above ^A total of 3,761 first-time first-year students were enrolled at K-State during Fall 2008. *A total of 758 first-year students completed the CAAP exam in Fall 2008 Values omitted from sample demographics: 23 non-first-year students completed CAAP (removed for VSA purposes) 2 students had missing data on “gender” and “ethnicity” ACT Composite scores were not available for 128 students Prepared by the Office of Assessment March 24, 2010 Kansas State University Senior CAAP Testing by College SPRING 2009 College Agriculture Architecture Arts & Sciences Business Education Engineering Human Ecology Tech. & Aviation Total Reading N % 42 20.3 1 0.5 46 22.2 85 41.1 0 0.0 0 0.0 33 15.9 0 0.0 207 100.0 CAAP Module Critical Thinking N % 53 22.2 0 0.0 44 18.4 29 12.1 0 0.0 0 0.0 101 42.3 12 5.0 239 100.0 Writing N % 1 0.4 0 0.0 0 0.0 40 15.3 0 0.0 167 63.7 54 20.6 0 0.0 262 100.0 Total Tested 708 *Note: The College of Engineering requested that the Writing Module be given to its students to assess their writing abilities for ABET accreditation purposes SPRING 2010 College Agriculture Architecture Arts & Sciences Business Education Engineering Human Ecology Tech. & Aviation Total Reading Natural Senior N % 21 8.2 0 0.0 45 17.5 75 29.2 29 11.3 44 17.1 26 10.1 17 6.6 257 100.0 CAAP Module Critical Thinking Natural Senior N % 24 8.5 0 0.0 41 14.6 77 27.4 37 13.2 59 21.0 25 8.9 18 6.4 281 100.0 Writing Natural Senior N % 22 8.7 0 0.0 49 19.4 55 21.7 36 14.2 39 15.4 42 16.6 10 4.0 253 100.0 Total Tested *Note: Nearly 1,200 students were tested to achieve K-State's goal of 750 'Natural' Seniors 791
