Document 13009558
advertisement
This file was created by scanning the printed publication.
Errors identified by the software have been corrected;
however, some errors may remain.
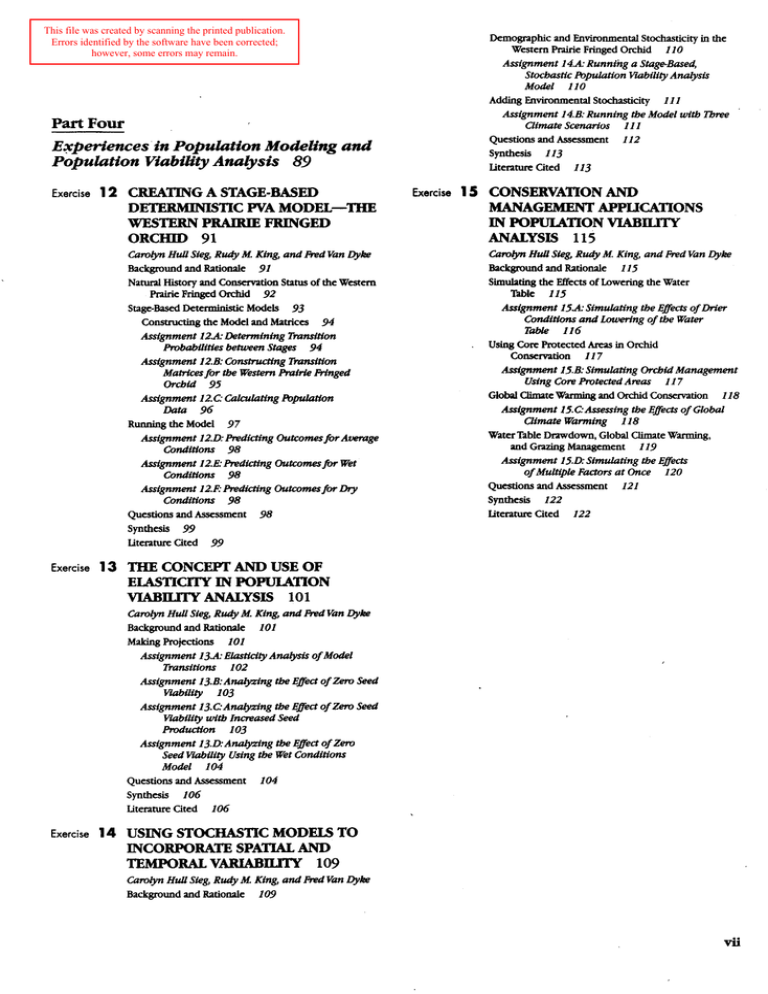
Demographic and Environmental Stochasticity in the
Western Prairie Fringed Orchid 110
Assignment 14.A.Running a Stage-Based,
Stocbastic Populatton Viability Analysts
Model 110
Adding Environmental Stochasticity 111
Assignment 14.B:Running tbe Model with Three
Climate Scenarios 111
Questions and Assessment 112
Synthesis 113
literature Cited 113
Part Four
E~perlences in Population Modeling and
Population Viability Analysis 89
Exercise 12
CREATING A STAGE-BASED
DETERMINISTIC PVA MODEL-TIlE
WESTERN PRAIRIE FRINGED
ORCmo
91
Carolyn Hull Sieg, Rudy M. King, and Fred Van Dyke
Background and Rationale 91
Natural History and Conservation Status of the Western
Prairie Fringed Orchid 92
Stage-BasedDeterministic Models 93
Constructing the Model and Matrices 94
Assignment 12.A:Determining Transition
Probabilities between Stages 94
Assignment 12.B: Constructing Transition
Matrices for tbe Western Prairie Fringed
Orcbid 95
Assignment 12.C:Calculating Population
Data 96
Running the Model 97
Assignment 12.D:Predicting Outcomes for Average
Conditions 98
Assignment 12.E:Predicting Outcomes for Wet
Conditions 98
Assignment 12.F:Predicting Outcomes for Dry
Conditions 98
Questions and Assessment
Synthesis 99
literature Cited 99
Exercise
98
Exercise
15 CONSERVATION AND
MANAGEMENT APPUCATIONS
IN POPULATION VIABITlTY
ANALYSIS 115
Carolyn Hull Sieg, Rudy M. King, and Fred Van Dyke
Background and Rationale 115
Simulating the Effects of Lowering the Water
Table 115
Assignment 15.A:Simulating tbe Effects of Drier
Conditions and Lowering of tbe Water
Tabie 116
Using Core Protected Areas in Orchid
Conservation 117
Assignment 15.B:Simulating Orchid Management
Using Core Protected Areas 117
Global ClimateWarming and Orchid Conservation 118
Assignment 15.C:Assessing tbe Effects of Global
Climate Warming 118
Water Table Drawdown, Global Climate Warming,
and Grazing Management 119
Assignment 15.D:Simulating the Effects
of Multiple Factors at Once 120
Questions and Assessment 121
Synthesis 122
literature Cited 122
13 TIlE CONCEPf AND USE OF
ELASTICITYIN POPULATION
VIABITlTY ANALYSIS 101
Carolyn Hull Sieg, Rudy M. King, and Fred Van Dyke
Background and Rationale 101
Making Projections 101
Assignment 13.A:Elasticity Analysis of Model
Transitions
102
Assignment 13.B:Analyzing tbe Effect of Zero Seed
Viability 103
Assignment HC: Analyzing the Effect of Zero Seed
Viability with Increased Seed
Production
103
Assignment 13.D:Analyzing tbe Effect of Zero
Seed Viability Using tbe Wet Conditions
Model 104
Questions and Assessment
Synthesis 106
literature Cited 106
Exercise
104
14 USING STOCHASTIC MODELS TO
INCORPORATE SPATIALAND
TEMPORAL VARlABITlTY 109
Carolyn Hull Sieg, Rudy M. King, and Fred Van Dyke
Background and Rationale 109
vii
EXERCISE
15
CONSERVATION
AND MANAGEMENT
ApPLICATIONS
IN POPULATION
VIABILITY
ANALYSIS
In this exercise, you will learn how to:
1. incorporate and evaluate long-term environmental
change, such as global climate change, into a stochastic population viability analysis model.
2. incorporate the effects of specific management
strategies, such as establishing core protected areas, into a stochastic population viability analysis
model.
3. evaluate combined, synergistic effects of long-term
environmental change and specific management
strategies on population viability and population
fluctuation.
BACKGROUND
AND RATIONALE
The western prairie fringed orchid is dependent on wetland habitat (U.S. Fish and Wildlife Service 1996). Prairie
wetlands in which the orchid has historically thrived are
usually ephemeral, filling with water in wet years and
drying up during droughts. Wetland abundance and persistence is a function not only of variations in annual
precipitation, but also of changes in groundwater levels
beneath the prairie surface. The u.S. Fish and Wildlife Service makes this relationship explicit in its definition of
wetlands by stating that "wetlands are lands transitional
between terrestrial and aquatic systems where the water
table (Le., groundwater) is at or near the surface. . ."
(Cowardin et al. 1979). Thus, in addition to having soil
moisture relatively near the surface, the number, extent,
and depth of prairie wetlands is strongly affected by the
amount of groundwater present in deeper, more permanent reservoirs known as aquifers. During periods of
high precipitation, some water falling or melting on the
surface of a landscape percolates through the soil and
reaches the groundwater, causing the water table to rise
closer to the surface, and contributing to greater extent
Exercise
15
and persistence
of wetlands. During dry periods, or
when groundwater is removed from the aquifer directly
by human activities, the level of the water table is
lowered.
Although local human activities cannot directly influence annual precipitation levels on the prairie, human
actions can and do cause changes in aquifer and water
table levels. In this exercise, we use the same population
model to examine the potential effects of lowering the
water table on populations of the western prairie fringed
orchid.
SIMULATING THE EFFECTS
OF LOWERING THE WATER TABLE
Recall that the population model of the western prairie
fringed orchid we have developed in exercises 12-14
is based on field data collected on in situ populations
of orchids between 1990 and 1998. Western prairie
fringed orchids, as noted earlier, are dependent on the
occurrence of wetland habitats in prairies, and wetland
abundance and distribution in this habitat is related to
the depth of the water table. We have no data on orchid
demographic rates after the lowering of the water
table. However, recall from exercises 12 and 13 that
populations of the orchid decline during dry periods or
when the water table is well below the soil surface, and
populations increase in response to wet conditions
when the water table rises to levels at or near the soil
surface. Thus, to simulate the effects of lowering the
water table over a longer period than just 1 or 2 years,
we increase the probabilities for the dry and average
climate scenarios and decrease the probability for the
wet climate scenario. In addition to having the likely effect of lowering the water table, an increasing frequency of average and dry conditions is also likely to
reduce levels of soil moisture, a condition adverse to
the orchid.
Conservation and Management Applications in Population Viability Analysis
115
Assignment
15.A: Simulating the Effects of Drier
Conditions and Lowering of the Water Table
1. Open the EXCELworkbook (from your workbook
website at www.mhhe.com/conservation) as in exercises 12-14. Select "Enable Macros" when prompted.
2. Switch to the exercise 15 worksheet.
3. Select the Tools pull-down menu and choose "Macro."
4. Select "Macros,"then "PVAStage,"then "Run."
5. PVAStage will ask for:
a. Length of time sequence: Type "22:'
b. Stage names: Highlight column A, rows 4
through 8, or type "a4:a8:'
c. Stage parameter for lambda calculations:
Select "Flowering plants."
d. Initial values: Highlight column B, rows 4
through 8, or type "b4:b8."
e. Ceiling values: Highlight column D, rows 4
through 8, or type "d4:d8."
f. Specification of first Lefkovitch matrix: Highlight the average matrix, or type "bI4:f18."
g. Next matrix: Highlight the wet matrix, or type
"b21:f25."
h. Next matrix: Highlight the dry matrix, or type
"b28:f32."
i. Next matrix: Select "CanceL"
j. How the Lefkovich matrix should be selected:
Select "Random."
k. Selection probability for matrix 1:Type "0.4"
1. Selection probability for matrix 2: Type "0.2"
m. Selection probability for matrix 3: Type "0.4"
n. Spedfy number of random sequences: Type
"1000" or select "Cancel" for the default of 1000.
o. Specify random number generator seed for
matrix selection: Select "97531."
p. Do you wish to specify element standard deviations? Select "No."
q. Monitor minimum threshold: Select"Yes:'
r. Minimum thresholdfor jloweringplants: Type"50:'
6. The program now provides a summary of the
model specifications: Make sure it says:
Sequence length is 22.
Stage names from Exercise 15!A4:A8
Initial stage parameter values from Exercise
15!B4:B8
Stage ceiling values from Exercise 15!D4:D8
Lefkovitch matrices from Exercise 15!BI4:FI8,
B21:F25, B28:F32
Random selection of matrices with selection
probabilities = {0.4, 0.2, 0.4}, 1000 random
sequence(s), with selection seed = 97531
Minimum threshold of 50 will be monitored for
flowering plants.
7. Begin computations? Select "Yes."
8. Extended results: Select "Flowering plants."
9. Plot selected population parameters? Select "Yes."
10. Select "Flowering plants."
116
Exercise
15
Stop and Reflect
1. Make a list of some actions by private landowners
or government management agencies that might result in lowering the water table, thereby, reducing
the amount of wetland habitat.
2. What effect did lowering the water table have on
the number of flowering orchids at the end of the
simulation?
a. How many flowering plants were present at the
end of the simulation?
b. Describe the 95% confidence interval for the
population in this simulation.
c. What was the final value of A?
Conservation and Management Applications in Population Viability Analysis
d. How does this compare to previous simulations
under average, wet, or dry conditions?
e. What percentage of iterations showed populations of < 50 flowering orchids at year 22?
3. Assume that you are the manager of a district of public rangeland on which orchid populations are present. Based on these results, what overall management
strategies could you implement or suggest regarding
groundwater use that would contribute to the protection and persistence of existing orchid populations?
elimination of disturbance is not feasible or desirable, or
when a disproportionate
number of individuals, habitat
patches, or landscape elements of high conservation
value exist in a relatively small and contiguous portion of
an area subject to management regulation.
One of the most common human-induced
environmental disturbances
affecting orchids is grazing by
livestock, especially cattle. Such grazing, which has longstanding historical precedent and local cultural significance and support, is an important economic component
of many rural communities. For many long-term residents
and their families, grazing is the economic basis of their
survival in the area. Grazing, however, may have detrimental effects on orchid populations, depending on its
timing, intensity, and frequency. Cattle can damage plants
by grazing or trampling. Grazing can reduce the number
of orchids that set fruit. Grazing may also function to create "regeneration niches" for the orchid or areas where reduced competition from other plants enhances orchid establishment (Bowles 1983).
On public lands such as those managed by the Bureau of Land Management (BLM) and the U.S. Forest Service (USFS), levels and types of grazing intensities are regulated, usually on individual grazing allotments
and
districts, by land managers who have authority, in conjunction with existing laws, elected political officials, and
the public, to set grazing fees, determine the length of
time and number of cattle using different areas, regulate
some aspects of water use for irrigation and livestock,
and prescribe other grazing management practices.
In a variation of assignment 15.A, we will employ
these concepts as we again simulate the effects of lowering the local water table on orchid populations. However, in this case we will designate a "protected area" in
which cattle grazing will be excluded at certain times of
the year (when orchids are actively growing, flowering,
and setting seed) from 30% of the available orchid habitat
in "core pastures" that collectively support more than
80% of the orchid metapopulation.
Assignment
Management
USING CORE PROTECTED AREAS
IN ORCHID CONSERVATION
Multiple-use modules (MUMs) and "zonation management" are sometimes used to protect species or habitats
of high conservation value in a landscape subject to multiple activities and uses (Noss and Harris 1986; Mech
1995;Van Dyke 2003). In such cases, a "core area" containing the most sensitive species, habitats, or other landscape elements is managed specifically to benefit these
elements. Zones at increasing distances from the core experience increasing use and alteration. Such a strategy
may be followed when complete protection from or
Exercise
15
Conservation
15.B: Simulating Orchid
Using Core Protected Areas
Run the model as previously, but this time designate the
three 30% ungrazed matrices in exercise 15 (l4:M8; 114:
M18; I24:M28). Use the same climatic probabilities that
you used in assignment 15.A:average = .4,wet = .2,and
dry = .4.
Stop and Reflect
1. What effect did lowering the water table, but protecting 30% of the orchid habitat in "core" pastures,
have on the number of flowering orchids at the end
of the simulation?
and Management
Applications
in Population Viability Analysis
117
a. How many flowering orchids were present at
the end of the simulation?
b. Describe the 95% confidence interval for the
population in year 22 in this simulation.
g. How might allowing cattle to graze in protected
areas after the orchid has disseminated its seeds
be beneficial versus completely excluding cattle
from these areas?
c. What was the final value of 'A.?
GLOBAL CliMATE WARMING
AND ORCHID CONSERVATION
d. How does this value compare to the previous
simulation in which there was no core protected
area?
e. What percentage of iterations had < 50 flowering orchids at year 22?
f. How does this percentage compare to the percentage of the previous simulation in which orchids were not protected?
118
Exercise
15
In North American prairie habitats today, evidence indicates that ongoing global climate trends are leading to
higher average temperatures and lower average annual
precipitation, conditions that contribute to lower levels
of soil moisture, greater rates of evapo-transpiration, and
overall higher levels of water stress in plants (Watson et
al. 1998). Such changes have the potential to not only reduce soil moisture, but to lower water tables and reduce
the size of wetland habitats (poiani and Johnson 1991),
effects that are likely to be detrimental to the wetlandadapted western prairie fringed orchid. In this assignment, we explore the possible effects of such trends by
increasing still further the probability of dry environmental conditions and decreasing the probability of wet
environmental conditions.
Assignment
15. C: Assessing the Effects of Global
Climate Warming
Run the environmental stochasticity model as previously
(see p. 111-112), but use the average, wet, and dry matrices in exercise 15 (b14:f18, b21:f25, b28:f32) and
change the probability of the average scenario to 0.2, the
probability of wet to 0.05, and the probability of dry to
0.75. (These changes are inserted to simulate both lowering the water table and global climate warming.) Then
answer the following questions.
Conservation and Management Applications in Population Viability Analysis
Stop and Reflect
1. How did lowering the water table, combined with
global climate warming, affect the number of flowering orchids at the end of the simulation?
a. What was the final population level of flowering
orchids?
b. Describe the 95% confidence interval of this
population.
4. What percentage of iterations had < 50 flowering
orchids at year 22?
5. How does this value compare to previous simulations in this exercise?
2. How do these values compare to simulations with
water table drawdown only? With simulations including core ungrazed areas?
WATER TABLE DRAWDOWN, GLOBAL
CLIMATE WARMING, AND GRAZING
MANAGEMENT
3. What was the final value of A?How does this value
compare to previous simulations in this exercise?
Exercise
15
Climatic changes and management practices often interact in unforeseen ways to affect the growth and persistence of populations. Models such as the one we have developed for the western prairie fringed orchid may be
useful in examining different effects simultaneously and
in identifying emergent, synergistic effects created by interactions that cannot be detected when each effect is
considered separately. In the following assignment, we
frame the model in such a way that the combined effects
of water table drawdown, global climate change, and
Conservation and Management Applications in Population Viability Analysis
119
grazing effects, previously considered separately, will be
allowed to operate simultaneously.
Assignment
15.D: Simulating the Effects
of Multiple Factors at Once
Run the environmental stochasticity model using the
core protected habitat (designating the three 30% 00grazed matrices in exercise 15) and the same climatic
probabilities as used in the scenario of water table drawdown and global climate warming (average = 0.2,wet =
0.05, dry = 0.75).
Stop and Reflect
1. How did protecting 30% of the orchid habitat in
"core" pastures when the orchid is actively growing, in combination with lowering the water table
and global climate change, affect the number of
flowering orchids at the end of the simulation?
5. What was the final value of A?How does this value
compare with previous exercises?
2. What was the final population level of flowering
plants?
3. Describe the 95% confidence interval of this population at year 22.
4. How do the population level of flowering plants
and associated confidence intervals compare to
previous simulations?
120
Exercise
15
6. What percentage of iterations had < 50 flowering
orchids at year 22? How does this percentage compare with previous simulations?
7. How did water table drawdown, simulated by increasing the probabilities for dry and average climate scenarios, affect the predicted population size
of western prairie fringed orchids, compared with
average conditions?
Conservation and Management Applications in Population Viability Analysis
8. How did climate change, combined with water
table drawdown, affect predicted population levels
of flowering orchids compared with average conditions? How did climate change affect the value of A?
QUESTIONS
2. Is it possible that some level of livestock grazing
could be beneficial to the persistence of the western prairie fringed orchid? Through what mechanisms and at what levels might such grazing
increase the establishment, numbers, distribution,
or persistence of orchid populations?
AND ASSESSMENT
1. Do you think that it would be feasible to protect
30% of the orchid's critical habitat when the orchid
is not actively growing (early June through midSeptember) on public lands with historically high
levels of livestock grazing? Why or why not? If this
is possible, identify the potential obstacles to such a
management strategy and how you would overcome
them. If you think this is not possible, explain why
the obstacles to implementing the 30% reserve
strategy could not be overcome.
3. The effect of livestock grazing depends on its timing, intensity, and frequency. In this exercise, we altered the timing of grazing by protecting a portion
of the orchid habitat when the orchid was actively
growing.
a. How could a manager also alter the intensity of
grazing?
Exercise
15
Conservation and Management Applications in Population Viability Analysis
121
b. How could a manager alter the frequency of
grazing?
tions by comparing relative differences between the
model outputs under different conditions.
These exercises demonstrate that protecting 30% of
the orchid habitat in "core" pastures when the orchid is
actively growing will result in increased growth rates of
orchid populations, compared to no protection. However, land managers are often faced with the reality that,
in spite of their good management, forces out of their
control, such as climate warming, cause species to decline and even become extinct. Local land managers cannot control the weather, and often have little control
over water management on adjacent lands. Although human beings cannot control the weather, they can plan
and manage for its effects. Indeed, the ability to manage
risk and uncertainty are key elements in all successful
conservation efforts.
LITERATURE CITED
c. How might changing the intensity or frequency
of grazing be beneficial to orchids?
SYNTHESIS
These models demonstrate the effect of changing the
probabilities associated with various climatic and management scenarios. We cannot forecast long-term climatic changes with certainty, and our data on demographic transitions of the western prairie fringed orchid
represent data collected over only 9 years. It is possible
that small changes in the amount or timing of precipitation could cause large changes in transition rates. Therefore, we cannot use these models to predict with certainty how many orchids will be present under varying
conditions. However, we can learn from these simula-
122
Exercise
15
Bowles, M. L. 1983. The tallgrass prairie orchids Platanthera leucophaea (Nutt.) Lindl. and Cypripedium
candidum Muhl. ex Willd.: Some aspects of their
status, biology, and ecology, and implications toward management. Natural Areas Journal 3:14-37.
Cowardin, L.M.,V.Carter, E C. Golet, and E.T.LaRoe.
1979. Classification of wetlands and deepwater
habitats of the United States. U.S.Department of
the Interior U.S.Fish and Wildlife Service, FWS/
OBS-79/31. U.S.Government Printing Office,
Washington, D.C.
Mech, L.D. 1995. The challenge and opportunity of recovering wolf populations. Conservation Biology
9:270-287.
Noss, R. E, and L.D. Harris. 1986. Nodes, networks, and
MUMs:Preserving diversity at all scales. Environmental Management 19:299-309.
Poiani, K. P.,and w: C.Johnson. 1991. Global warming
and prairie wetlands: Consequences for waterfowl
habitat. BioScience 41(9):611-618.
U.S.Fish and Wildlife Service. 1996. Platanthera
praeclara (western prairie fringed orchid) recovery
plan. u.s. Fish and Wildlife Service, Ft. Snelling, MN.
Van Dyke, E 2003. Conservation biology: Foundations,
concepts, applications. New York: McGraw-Hill.
Watson, R. T.,M. C. Zinyowera, and R. H. Moss, eds.
1998. The regional impacts of climate change: An
assessment of vulnerability. Intergovernmental
Panel on Climate Change. New York: Cambridge
University Press.
Conservation and Management Applications in Population Viability Analysis
