5th Grade Science: Mass & Motion Lesson Plan
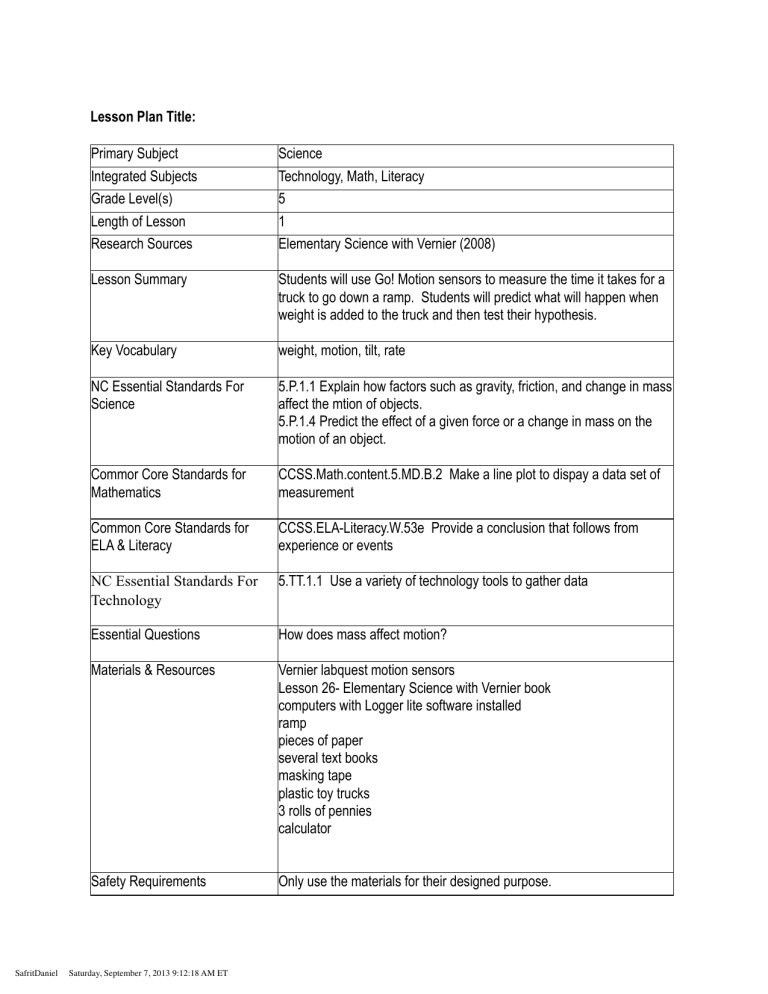
Lesson Plan Title:
Primary Subject
Integrated Subjects
Grade Level(s)
Length of Lesson
Research Sources
Lesson Summary
5
1
Science
Technology, Math, Literacy
Elementary Science with Vernier (2008)
Students will use Go! Motion sensors to measure the time it takes for a truck to go down a ramp. Students will predict what will happen when weight is added to the truck and then test their hypothesis.
weight, motion, tilt, rate Key Vocabulary
NC Essential Standards For
Science
5.P.1.1 Explain how factors such as gravity, friction, and change in mass affect the mtion of objects.
5.P.1.4 Predict the effect of a given force or a change in mass on the motion of an object.
CCSS.Math.content.5.MD.B.2 Make a line plot to dispay a data set of measurement
Commor Core Standards for
Mathematics
Common Core Standards for
ELA & Literacy
CCSS.ELA-Literacy.W.53e Provide a conclusion that follows from experience or events
NC Essential Standards For
Technology
Essential Questions
5.TT.1.1 Use a variety of technology tools to gather data
How does mass affect motion?
Materials & Resources Vernier labquest motion sensors
Lesson 26- Elementary Science with Vernier book computers with Logger lite software installed ramp pieces of paper several text books masking tape plastic toy trucks
3 rolls of pennies calculator
Safety Requirements Only use the materials for their designed purpose.
SafritDaniel Saturday, September 7, 2013 9:12:18 AM ET
Activities/Procedures
• Essential Question
• Explore/Engage
• Explain
• Elaborate (Inquiry)
• Evaluate
Accommodations for
Differentiated Instruction
Cross Curricular
Integration
Created by
Supporting Documents
Essential question: How does mass affect motion?
Explore/Engage: Students will create a hypothesis on if their truck will lose or gain speed based on weight change.
Students will design and create a ramp in which to roll their truck.
Students will conduct 4 different trials using 0, 1,2 and 3 penny rolls.
Students will collect their data for these trials on the labquest using the motion sensors.
Explain: After data collection students will graph their data using the logger lite program. An evaluation of their hypothesis will follow this graphing.
Elaborate: The class will discuss their finding and form a conclusion about the addidion of weight and how if affects motion.
Evaluate: The teacher will collect and review their graphs and evaluate student participation in the lesson.
Visual: The teacher will project the logger lite program to the white board.
Auditory: The motion sensors can emit a beeping sound to alert the student to movement.
Kinestetic: The student can dramatize the motion.
Students will graph their motion data on the computer and compare and contrast the results.
lhunsucker@northhillschristian.com
Teacher Notes, Flipcharts, Labs, Data Sheets, Rubrics, etc.
SafritDaniel Saturday, September 7, 2013 9:12:18 AM ET
