Space-Time Pattern Analysis: CASE STUDY (4 of 5)
advertisement
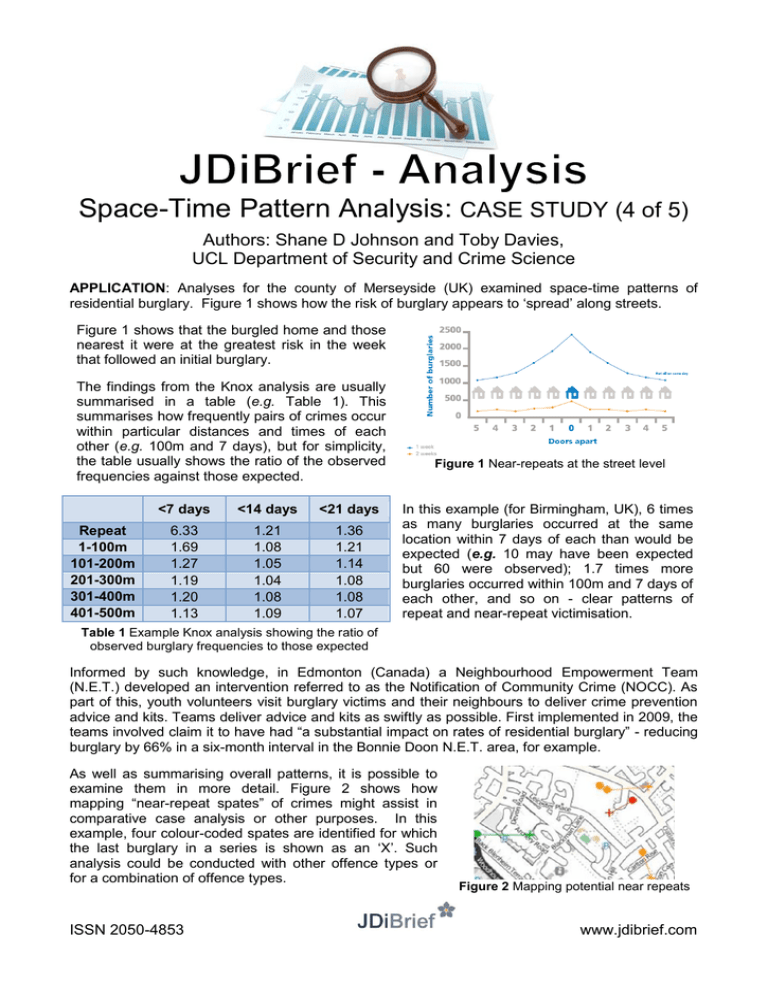
Space-Time Pattern Analysis: CASE STUDY (4 of 5) Authors: Shane D Johnson and Toby Davies, UCL Department of Security and Crime Science APPLICATION: Analyses for the county of Merseyside (UK) examined space-time patterns of residential burglary. Figure 1 shows how the risk of burglary appears to ‘spread’ along streets. Figure 1 shows that the burgled home and those nearest it were at the greatest risk in the week that followed an initial burglary. The findings from the Knox analysis are usually summarised in a table (e.g. Table 1). This summarises how frequently pairs of crimes occur within particular distances and times of each other (e.g. 100m and 7 days), but for simplicity, the table usually shows the ratio of the observed frequencies against those expected. Repeat 1-100m 101-200m 201-300m 301-400m 401-500m <7 days <14 days <21 days 6.33 1.69 1.27 1.19 1.20 1.13 1.21 1.08 1.05 1.04 1.08 1.09 1.36 1.21 1.14 1.08 1.08 1.07 Figure 1 Near-repeats at the street level In this example (for Birmingham, UK), 6 times as many burglaries occurred at the same location within 7 days of each than would be expected (e.g. 10 may have been expected but 60 were observed); 1.7 times more burglaries occurred within 100m and 7 days of each other, and so on - clear patterns of repeat and near-repeat victimisation. Table 1 Example Knox analysis showing the ratio of observed burglary frequencies to those expected Informed by such knowledge, in Edmonton (Canada) a Neighbourhood Empowerment Team (N.E.T.) developed an intervention referred to as the Notification of Community Crime (NOCC). As part of this, youth volunteers visit burglary victims and their neighbours to deliver crime prevention advice and kits. Teams deliver advice and kits as swiftly as possible. First implemented in 2009, the teams involved claim it to have had “a substantial impact on rates of residential burglary” - reducing burglary by 66% in a six-month interval in the Bonnie Doon N.E.T. area, for example. As well as summarising overall patterns, it is possible to examine them in more detail. Figure 2 shows how mapping “near-repeat spates” of crimes might assist in comparative case analysis or other purposes. In this example, four colour-coded spates are identified for which the last burglary in a series is shown as an ‘X’. Such analysis could be conducted with other offence types or for a combination of offence types. ISSN 2050-4853 Figure 2 Mapping potential near repeats www.jdibrief.com
