Risk-based Fatigue Estimate of Deep Water Risers
advertisement

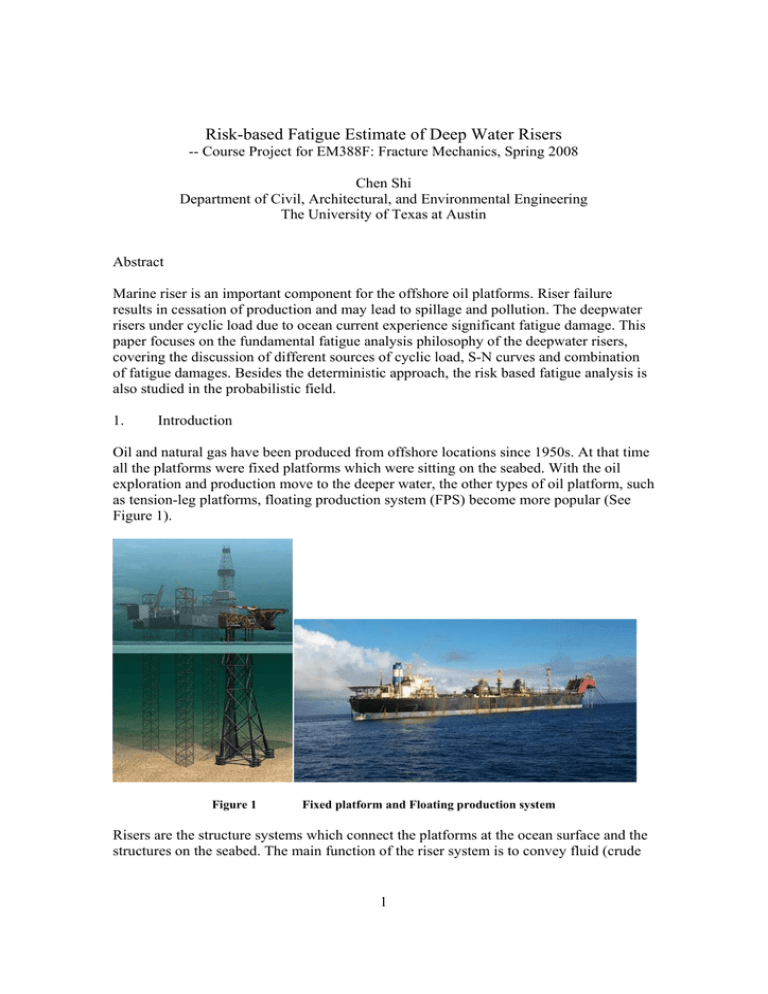
Risk-based Fatigue Estimate of Deep Water Risers -- Course Project for EM388F: Fracture Mechanics, Spring 2008 Chen Shi Department of Civil, Architectural, and Environmental Engineering The University of Texas at Austin Abstract Marine riser is an important component for the offshore oil platforms. Riser failure results in cessation of production and may lead to spillage and pollution. The deepwater risers under cyclic load due to ocean current experience significant fatigue damage. This paper focuses on the fundamental fatigue analysis philosophy of the deepwater risers, covering the discussion of different sources of cyclic load, S-N curves and combination of fatigue damages. Besides the deterministic approach, the risk based fatigue analysis is also studied in the probabilistic field. 1. Introduction Oil and natural gas have been produced from offshore locations since 1950s. At that time all the platforms were fixed platforms which were sitting on the seabed. With the oil exploration and production move to the deeper water, the other types of oil platform, such as tension-leg platforms, floating production system (FPS) become more popular (See Figure 1). Figure 1 Fixed platform and Floating production system Risers are the structure systems which connect the platforms at the ocean surface and the structures on the seabed. The main function of the riser system is to convey fluid (crude 1 oil or the natural gas) between wells and platforms. Typically the risers are made of steel or titanium pipe with an outer diameter less than 30 inches and a wall thickness less than 1 inch (See Figure 2). With the production moving into deeper water, the risers become longer and longer, usually are about 3,000 ~ 6000 feet, and the longest ones are over 10,000 feet. The risers are prone to be vibrated under the excitation of current flow due to their slenderness and low-damping ratios. The sustain vibration may cause fatigue damage which may lead to cessation of production or spillage and pollution to the ocean. In this paper, the basic steps of riser fatigue analysis were outlined. The procedures to estimate the probability of fatigue failure using Monte Carlo simulation were introduced also. Figure 2 2 Risers Riser Fatigue Analysis 2.1 Two types of components Generally the fatigue life consists of two phases: crack initiation and crack propagation. For the un-welded components, such as the seamless pipes, the crack initiation period takes over 95% of the total fatigue life. And the fatigue strength increases with material tensile strength. For the welded joints, the initial cracks, such as the welded toes, always present. The crack propagation period represents the bulk of the total fatigue life. The crack propagation rate is dependent on the properties of base material, environment and other factors, so there is no consistent trend between fatigue strength and material tensile strength. 2.2 Fatigue criterion and S-N curves The fatigue criterion is represented by D fat × DFF ≤ 1 where D fat = Accumulated fatigue damage, estimated by Palmgren-Miner rule DFF = Design fatigue factor, which depends on the safety classes, see Table 1. 2 Table 1 Safety class Low Normal High Classification of Safety class and DFF values Definition Where failure implies low risk of human injury and minor environmental and economic consequences Where failure implies risk of human injury, significant environmental pollution or very high economic or political consequences Where failure implies high risk of human injury, significant environmental pollution or very high economic or political consequences DFF 3.0 6.0 10.0 If appropriate, fracture mechanics may be used to analyze the riser fatigue. However, the S-N curves based approach is commonly used which correlates the number of stress cycles to failure and a constant stress range. N = a × S −m ⇔ log( N ) = log( a ) − m × log( S ) N: Number of stress cycles to failure S: Constant stress range a, m : Empirical constants obtained from experiments 2.3 Fatigue loads Riser fatigue analysis should consider all relevant cyclic load effects, such as (a) First order wave effects (b) Second order floater motion (c) Vortex induced vibration (d) Thermal and pressure induced stress cycles (e) Collisions (f) Fabrication and installation loads (g) Others cyclic loads. Typically, first order wave effects, second order floater motion, and vortex induced vibration have relatively larger contribution to riser fatigue. This paper will focus on the analysis of fatigue due to the first order wave effects and second order floater motion. The first order wave effects is also called ‘wave frequency effects’, which includes wave frequency floater motions and direct wave loading on risers. Second order floater motion means low frequency (the frequency is much lower than the natural frequency) response of floater motions, so also called ‘low frequency effects’. 3 Long-term fatigue damage due to wave frequency and low frequency effects The general approach for estimate the wave frequency and low frequency fatigue damage takes the following procedures. 3 (a) Divide all sea current state data into a number of representative blocks; (b) Use a single sea state to represent all the sea-state within one block. The probabilities of occurrence for all sea-states within the block are lumped to the selected sea-state. Here should be noted that, the selected sea-state should give equal or greater damage than all the original sea-state with the block. (c) The long-term fatigue damage is equal to the weighted summation of all short-term fatigue damage, expressed as Ns D fat = ∑ Di Pi i =1 in which D fat : Long-term fatigue damage N S : Number of single sea-state, number of blocks of sea-state Di : Short-term fatigue damage Pi : Sea-state probability Table 2 and Table 3 give an example of the scattered sea states and the lumped sea states. Table 2 shows the probability of scatted sea states which are grouped by wave height ( H s ) and wave period ( Tp ). For example the sea state having wave period Tp = 8 ~ 10 sec. and wave height H s = 1.00 ~ 1.25 meters accounts for 4.74% of total occurrence. Note that this table is uncompleted. It does not include the sea states having period 4~6 sec. All the scattered sea states were lumped and represented by 7 representative sea states, which are summarized in Table 3. H se is the effective wave height for each representative sea state, which will give equivalent fatigue damage compared to all the scattered sea state in that bin. Calculate the short term fatigue damage for each lumped sea state, weighed by the sea state probability and the final summation will give the long term fatigue damage. 4 Table 2 Table 3 4 Scattered sea states (uncompleted) Lumped sea states Short Term Fatigue -S-N Curves Approach The S-N curves approach is the general practice to calculate the short term fatigue in the riser industry. Besides the linear S-N curves, the bilinear S-N curves represent the experimental data better and are frequently used. So here the method of using the bilinear S-N curves and the Miner-Palmgren rule to estimate the accumulated fatigue damage are introduced. 4.1 Bilinear S-N curves ⎧⎪a1 × S − m1 S > S sw N =⎨ ⎪⎩a 2 × S − m 2 S ≤ S sw As same as the linear S-N curves, N is the number of stress cycles to failure, for a constant stress range S. a1 , a2 and m1 , m2 are empirical constants obtained from experiments. The basic definition of bilinear S-N curves is showed in a log-log scaled plot, see Figure 3. 5 Figure 3 4.2 Definition of Bilinear S-N curves (log-log scales) Miner-Palmgren rule Palmgren-Miner rule is used for accumulation of fatigue damage caused by variable stress amplitudes. The basic equation is D=∑ i n( S i ) N (S i ) When n( S i ) is the number of stress cycles with stress range S i ; and N ( S i ) is the number of stress cycles to failure with stress range S i . For a given time T , the accumulated fatigue damage can be obtained from the following equation, D= TfV a2 ∫ S sw 0 S m2 × f s ( s ) ds + TfV a1 ∫ ∞ S sw S m1 × f s ( s ) ds In which, fV = Mean frequency of stress cycles f s (s ) = Probability density function for stress cycles The above equations constitute the basic formulations for accumulated fatigue damage under stationary environmental conditions 6 5 Fatigue Stress The fatigue stress considered for risers is the principle stress with a thickness correction factor. 5.1 Thickness correction factor ⎛ t fat S = S 0 × SCF × ⎜ ⎜t ⎝ ref ⎞ ⎟ ⎟ ⎠ k Where: S 0 = Nominal stress range SCF = Stress concentration factor k ⎛ t fat ⎞ ⎜ ⎟ = Thickness correction factor. Applies for pipes with a wall thickness t fat greater ⎜t ⎟ ⎝ ref ⎠ than a reference wall thickness t ref = 25mm ⎧tnorm t fat = ⎨ ⎩tnorm − 0.5 × tcorr before installation after installation tnorm = Nominal pipe wall thickness tcorr = Corrosion allowance, assuming linear corrosion loss 5.2 Nominal stress The nominal stress component of pipes is a linear combination of the axial and bending stresses given by σ (t ) = σ a (t ) + σ M (θ , t ) Axial stress: σ a (t ) = Te (t ) π ( D − t fat )t fat ⎛ D − t fat Bending stress: σ M (θ , t ) = (M y (t ) sin(θ ) + M Z (t ) cos(θ ) )× ⎜⎜ ⎝ 2I ⎞ ⎟⎟ ⎠ In which, D is the outer diameter. Te is the effective tension. M y and M Z are the bending moments about the local y and z axes, I is the moment of inertia. See Figure 4. The stress varies along the circumference, so at least 8 points along the circumference needs to be analyzed to identify the most critical location. 7 Figure 4 6. Cross-section of risers Uncertainties of Fatigue Estimate and Monte Carlo Simulation Many factors associate with riser fatigue analysis, including the input variables (such as drag coefficient, pipe wall thickness, etc.), are stochastic in nature. These uncertainties need to be studied and the probabilistic models for all stochastic variables should be set up based on literature, experience and data analysis. If lacking of information, the values in Table 4 may be used. Table 4 Stochastic variables After appropriate probabilistic models obtained for all the stochastic variables, Monte Carlo simulation can be used to get the risk based fatigue estimation. The advantage of Monte Carlo simulation is that given accurate probabilistic models any desired level of accuracy can be achieved by increasing the number of iteration. The basic steps of the Monte Carlo simulations are outlined as following, (1) Establish the probabilistic model (mode type, mean and standard deviation) for each independent basic input variables; 8 (2) Sampling probability distribution to obtain point estimate for each independent input variable; (3) Calculate dependent and then output variables; (4) Do loop for sets 2-3 (typically more than 100,000 times for satisfied accuracy); (5) Post-process results to obtain probabilistic distribution of the output. 7. Summary (1) Fatigue damage estimation is critical important for riser design and analysis. Unfortunately, the procedures and considerations are very complex. (2) Bilinear S-N curves and Miner rule are the typical approach. (3) Fatigue damage and fatigue life can be estimated by using the mean value of the input variables. (4) Probability of fatigue failure can be estimated by the stochastic model of the input variables and Monte Carlo simulation. 8. Reference DNV, 2005, Riser fatigue, DNV-RP-F204 Sen, T.K., Probability of fatigue failure in steel catenary risers in Deep Water, Journal of Engineering Mechanics, Sep. 2006 9


