Z I B ICP
advertisement
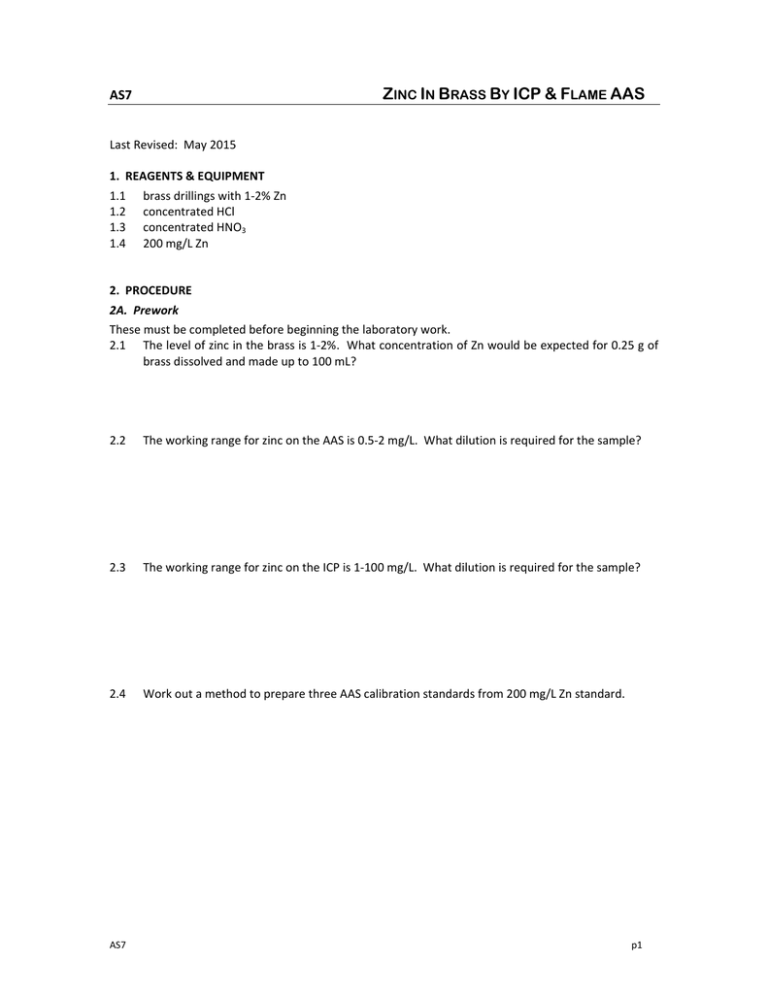
ZINC IN BRASS BY ICP & FLAME AAS AS7 Last Revised: May 2015 1. REAGENTS & EQUIPMENT 1.1 brass drillings with 1‐2% Zn 1.2 concentrated HCl 1.3 concentrated HNO3 1.4 200 mg/L Zn 2. PROCEDURE 2A. Prework These must be completed before beginning the laboratory work. 2.1 The level of zinc in the brass is 1‐2%. What concentration of Zn would be expected for 0.25 g of brass dissolved and made up to 100 mL? 2.2 The working range for zinc on the AAS is 0.5‐2 mg/L. What dilution is required for the sample? 2.3 The working range for zinc on the ICP is 1‐100 mg/L. What dilution is required for the sample? 2.4 Work out a method to prepare three AAS calibration standards from 200 mg/L Zn standard. AS7 p1 2B. Sample preparation 2.5 Weigh, in triplicate, accurately about 0.25 g of sample. Transfer to 150 mL beakers marked S1, S2 and RC. 2.6 To the beaker labelled RC, pipette 10 mL of 200 mg/L Zn as a recovery check. 2.7 Label a fourth beaker B. It will serve as a blank. 2.8 Add concentrated HCl (20 mL) and concentrated HNO3 (10 mL) to each beaker. 2.9 Add water (10 mL) to each beaker except RC. 2.10 When dissolved, evaporate down to about 10‐15 mL. Do not evaporate to dryness. 2.11 Transfer quantitatively to 100 mL volumetric flasks, labelled accordingly, and make up to volume with distilled water. 2.12 Pipette the aliquot volume calculated in Prework 2.3 into labelled 250 mL volumetric flasks and make up to the mark. 2.13 Prepare the series of standards as per Prework 2.4 for the AAS. 2.14 Prepare 10 & 50 mg/L standards for the ICP (the 1 mg/L standard from the AAS will be used here as well). 2C. Analysis 2.15 Set up the AAS for zinc analysis, using the wavelength chosen in Prework 2.2. 2.16 Measure the absorbance of each standard and sample. 2.17 Measure the intensities for of each standard and sample on the ICP. REPORT Calculations The following needs to be done for both sets of results. Analysis 1. Plot the calibration graph from the standard results, and determine the line of best fit. 2. Calculate the Zn concentration in each sample (S1, S2 & RC) from the calibration graph. 3. Apply the dilution factor to determine the Zn concentration in the original solution. 4. Calculate the mass of Zn in the original solutions. 5. For S1 and S2, calculate the %w/w of Zn. 6. Calculate the average %w/w Zn. Recovery check 7. Use the average value calculated in step 6 to calculate the mass of Zn in the RC flask due to the sample (m2). 8. Calculate the mass of Zn added in step 2.6 as the recovery check (m3). 9. The mass of Zn in the RC flask calculated in step 4 above is m1. 10. Calculate the % recovery using the equation below. m1 m2 % re cov ery 100 x m3 Discussion compare the results for the two techniques compare the results to the expected value comment on the recovery check values Questions 1. What is the function of zinc in brass? What are the typical concentrations? 2. If matrix‐matched standards were to be used, what would be the best way of preparing them? AS7 p2 AS7. ANALYSIS OF ZINC IN BRASS BY ICP & FLAME AAS RESULTS SHEET Sample 1 mass (g) Sample 2 mass (g) RC mass (g) AAS mg/L Abs. Standard 1 Standard 2 Standard 3 Sample 1 Sample 2 RC ICP mg/L Intensities Standard 1 1 Standard 2 10 Standard 3 50 Sample 1 Sample 2 RC
