BRIEF COMMUNICATION: Can milk urea nitrogen differentiate nitrogen use efficiency... lactating cow groups raised on New Zealand pasture?
advertisement

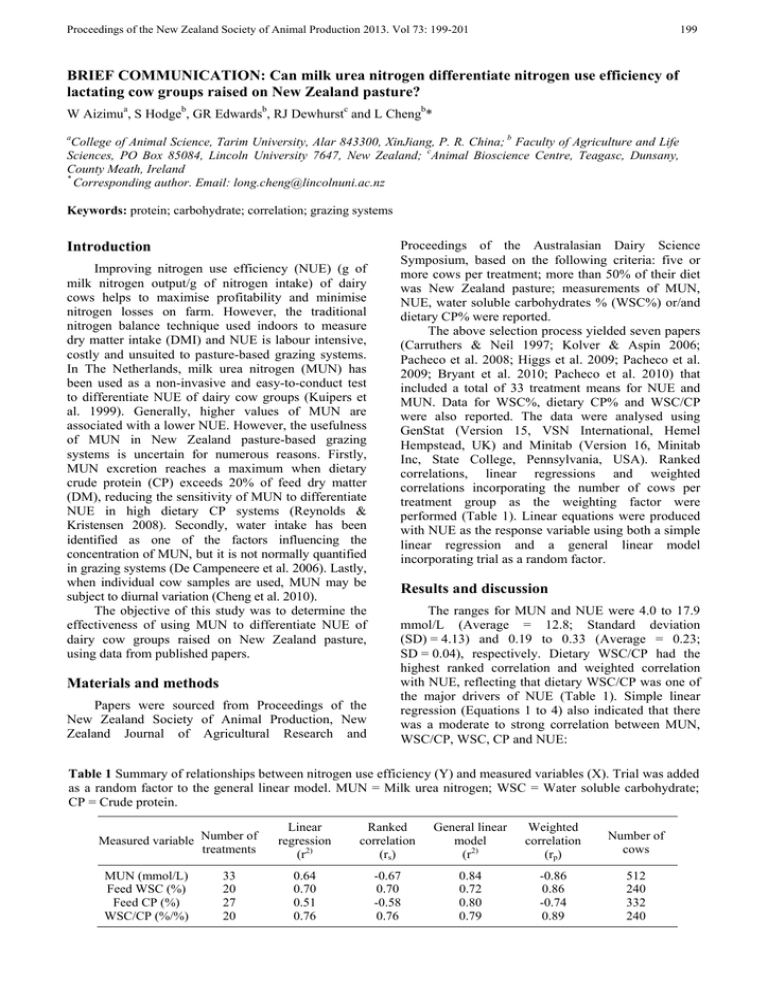
Proceedings of the New Zealand Society of Animal Production 2013. Vol 73: 199-201 199 BRIEF COMMUNICATION: Can milk urea nitrogen differentiate nitrogen use efficiency of lactating cow groups raised on New Zealand pasture? W Aizimua, S Hodgeb, GR Edwardsb, RJ Dewhurstc and L Chengb* a College of Animal Science, Tarim University, Alar 843300, XinJiang, P. R. China; b Faculty of Agriculture and Life Sciences, PO Box 85084, Lincoln University 7647, New Zealand; cAnimal Bioscience Centre, Teagasc, Dunsany, County Meath, Ireland * Corresponding author. Email: long.cheng@lincolnuni.ac.nz Keywords: protein; carbohydrate; correlation; grazing systems Introduction Improving nitrogen use efficiency (NUE) (g of milk nitrogen output/g of nitrogen intake) of dairy cows helps to maximise profitability and minimise nitrogen losses on farm. However, the traditional nitrogen balance technique used indoors to measure dry matter intake (DMI) and NUE is labour intensive, costly and unsuited to pasture-based grazing systems. In The Netherlands, milk urea nitrogen (MUN) has been used as a non-invasive and easy-to-conduct test to differentiate NUE of dairy cow groups (Kuipers et al. 1999). Generally, higher values of MUN are associated with a lower NUE. However, the usefulness of MUN in New Zealand pasture-based grazing systems is uncertain for numerous reasons. Firstly, MUN excretion reaches a maximum when dietary crude protein (CP) exceeds 20% of feed dry matter (DM), reducing the sensitivity of MUN to differentiate NUE in high dietary CP systems (Reynolds & Kristensen 2008). Secondly, water intake has been identified as one of the factors influencing the concentration of MUN, but it is not normally quantified in grazing systems (De Campeneere et al. 2006). Lastly, when individual cow samples are used, MUN may be subject to diurnal variation (Cheng et al. 2010). The objective of this study was to determine the effectiveness of using MUN to differentiate NUE of dairy cow groups raised on New Zealand pasture, using data from published papers. Materials and methods Papers were sourced from Proceedings of the New Zealand Society of Animal Production, New Zealand Journal of Agricultural Research and Proceedings of the Australasian Dairy Science Symposium, based on the following criteria: five or more cows per treatment; more than 50% of their diet was New Zealand pasture; measurements of MUN, NUE, water soluble carbohydrates % (WSC%) or/and dietary CP% were reported. The above selection process yielded seven papers (Carruthers & Neil 1997; Kolver & Aspin 2006; Pacheco et al. 2008; Higgs et al. 2009; Pacheco et al. 2009; Bryant et al. 2010; Pacheco et al. 2010) that included a total of 33 treatment means for NUE and MUN. Data for WSC%, dietary CP% and WSC/CP were also reported. The data were analysed using GenStat (Version 15, VSN International, Hemel Hempstead, UK) and Minitab (Version 16, Minitab Inc, State College, Pennsylvania, USA). Ranked correlations, linear regressions and weighted correlations incorporating the number of cows per treatment group as the weighting factor were performed (Table 1). Linear equations were produced with NUE as the response variable using both a simple linear regression and a general linear model incorporating trial as a random factor. Results and discussion The ranges for MUN and NUE were 4.0 to 17.9 mmol/L (Average = 12.8; Standard deviation (SD) = 4.13) and 0.19 to 0.33 (Average = 0.23; SD = 0.04), respectively. Dietary WSC/CP had the highest ranked correlation and weighted correlation with NUE, reflecting that dietary WSC/CP was one of the major drivers of NUE (Table 1). Simple linear regression (Equations 1 to 4) also indicated that there was a moderate to strong correlation between MUN, WSC/CP, WSC, CP and NUE: Table 1 Summary of relationships between nitrogen use efficiency (Y) and measured variables (X). Trial was added as a random factor to the general linear model. MUN = Milk urea nitrogen; WSC = Water soluble carbohydrate; CP = Crude protein. Measured variable Number of treatments MUN (mmol/L) Feed WSC (%) Feed CP (%) WSC/CP (%/%) 33 20 27 20 Linear regression (r2) Ranked correlation (rs) General linear model (r2) Weighted correlation (rp) Number of cows 0.64 0.70 0.51 0.76 -0.67 0.70 -0.58 0.76 0.84 0.72 0.80 0.79 -0.86 0.86 -0.74 0.89 512 240 332 240 200 Aizimu et al. – Nitrogen use efficiency in cows [Equation 1] NUE (g/g) = 0.17 + 0.065 × WSC/CP [Equation 2] (%/%) (r2 = 0.76; P <0.001) NUE (g/g) = 0.12 + 0.006 × WSC (%) [Equation 3] (r2 = 0.70; P <0.001) NUE (g/g) = 0.37 - 0.007 × CP (%) (r2 = 0.51; P <0.001) [Equation 4] Incorporating ‘trial’ as a random factor into the general linear model enhanced the relationships between MUN, WSC/CP, WSC, CP, and NUE (Equations 5 to 8). One of the reasons for this enhancement is likely to be the effect of different MUN analytical methods among the trials being considered (Broderick 2003). NUE (g/g) = 0.31 - 0.008 × MUN (mmol/L) (r2 = 0.84; P <0.001) [Equation 5] NUE (g/g) = 0.15 + 0.086 × WSC/CP (%/%) [Equation 6] (r2 = 0.79; P <0.001) Figure 1. Scatter plot of (a) treatment means of milk urea nitrogen (n = 33 cows) and (b) water soluble carbohydrates to crude protein ratio (WSC/CP) (n = 20 cows) against nitrogen use efficiency of cow groups raised on New Zealand pasture. (a) Nitrogen use efficiency (g of milk nitrogen / g of nitrogen intake) NUE (g/g) = 0.32 - 0.007 × MUN (mmol/L) (r2 = 0.64; P <0.001) 0.35 0.30 0.25 0.20 0.15 0 NUE (g/g) = 0.08 + 0.008 × WSC (%) [Equation 7] (r2 = 0.72; P = 0.001) 15 20 Dietary CP <20% of DM Dietary CP >20% of DM Unknown CP% [Equation 8] A review by Reynolds and Kristensen (2008) showed that when dietary CP exceeded 20% of DM fed to cows, as may occur with protein supplementation, MUN excretion reached a plateau value. This may lead to a reduction in the sensitivity of using MUN to differentiate NUE. To explore this further, two levels of dietary CP were used to separate the data points in Figure 1a and 1b. It shows that there was a clear negative linear relationship between MUN and NUE when dietary CP was less than 20 % of DM (r2 = 0.73). On the other hand, no linear relationship was observed when dietary CP exceeded 20 % of DM (r2 = 0.003) (Figure 1a). Similarly, Figure 1b shows that WSC/CP was only a good indicator of NUE when the dietary CP <20 % of the DM being fed. Linear regression analysis showed the correlation coefficient was 0.72 and 0.058 between WSC/CP and NUE when dietary CP of less than 20% and more than 20% of the DM being fed, respectively. This may be due to excess nitrogen in the diet over and above that required by a lactating cow of a CP content in the diet of 18% of the DM, was mainly excreted through urine rather than being utilised for milk nitrogen production. This resulted in a low NUE (Pacheco & Waghorn 2008). Overall, this study illustrated that MUN and WSC/CP may be used to differentiate NUE of dairy cow groups raised on New Zealand pasture when the dietary CP is less than 20 % of the available DM. However, further validation is needed to confirm this finding using a larger data set. Alternative method to indicate NUE when dietary CP is more than 20% of DM should also be explored. 10 Milk urea nitrogen (mmol/L) (b) Nitrogen use efficiency (g of milk nitrogen / g of nitrogen intake) NUE (g/g) = 0.39 - 0.008 × CP (%) (r2 = 0.80; P <0.001) 5 0.35 0.30 0.25 0.20 0.15 0.0 0.5 1.0 1.5 2.0 2.5 3.0 WSC/CP (%/%) Dietary CP <20% of DM Dietary CP >20% of DM Acknowledgements Thanks go to the China Scholarship Council (CSC) for funding W Aizimu to work at Lincoln University. We acknowledge Prof. CH Ma from Tarim University for his encouragement. Proceedings of the New Zealand Society of Animal Production 2013. Vol 73: 199-201 References Broderick GA 2003. Effects of varying dietary protein and energy levels on the production of lactating dairy cows. Journal of Dairy Science 86: 1370–1381. Bryant RH, Walpot V, Dalley DE, Gibbs SJ, Edwards GR 2010. Manipulating dietary N in perennial ryegrass pastures to reduce N losses in dairy cows in spring. Proceedings of the 4th Australasian Dairy Science Symposium. 31 August–2 September 2010. Lincoln University, New Zealand. Pg. 97–100. Carruthers VR, Neil PG 1997. Milk production and ruminal metabolites from cows offered two pasture diets supplemented with non-structural carbohydrate. New Zealand Journal of Agricultural Research 40: 513–521. Cheng L, Dewhurst R, Larkin J, Buckley F, Thackaberry C, Edwards G 2010. The relationship between nitrogen use efficiency and isotopic fractionation in dairy cows using milk samples collected in the morning or afternoon. Journal of Dairy Science 93 E-Supplement 1: 441. De Campeneere S, De Brabander DL, Vanacker JM 2006. Milk urea concentration as affected by the roughage type offered to dairy cattle. Livestock Science 103: 30–39. Higgs RJ, Cosgrove GP, Burke JL, Lane GA, Pacheco D, Fraser K, Death AF, Ford JL 2009. Effect of white clover containing either high or low concentrations of water-soluble carbohydrate on metabolic indicators of protein degradation in the rumen of dairy cows. Proceedings of the New Zealand Society of Animal Production 70: 23–28. 201 Kolver ES, Aspin PW 2006. Supplemental fumarate did not influence milk solids or methane production from dairy cows fed high quality pasture. Proceedings of the New Zealand Society of Animal Production 66: 409–415. Kuipers A, Mandersloot F, Zom RLG 1999. An approach to nutrient management on dairy farms. Journal of Animal Sciences 77: 84–89. Pacheco D, Lane GA, Fraser K, Mcdonald KA, Back PJ 2008. Indole and skatole as markers for nitrogen utilisation in dairy cows. Proceedings of the New Zealand Society of Animal Production 68: 23–26. Pacheco D, Waghorn GC 2008. Dietary nitrogen – definitions, digestion, excretion and consequences of excess for grazing ruminants. Proceedings of the New Zealand Grassland Association 70: 107–116. Pacheco D, Lowe K, Burke JL, Cosgrove GP 2009. Urinary nitrogen excretion from cows at different stage of lactation grazing different ryegrass cultivars during spring or autumn. Proceedings of the New Zealand Society of Animal Production 69: 196–200. Pacheco D, Burke JL, Cosgrove GP 2010. The effect of different methods of presenting ryegrass and white clover diets on nitrogen utilisation by cows. Proceedings of the 4th Australasian Dairy Science Symposium. 31 August–2 September Lincoln University, New Zealand. Pg. 101–105. Reynolds CK, Kristensen NB 2008. Nitrogen recycling through the gut and the nitrogen economy of ruminants: Anasynchronous symbiosis. Journal of Animal Science (E Supplement) 86: E293–E305.


