Safe & Sound Partnership: managing the prevention
advertisement
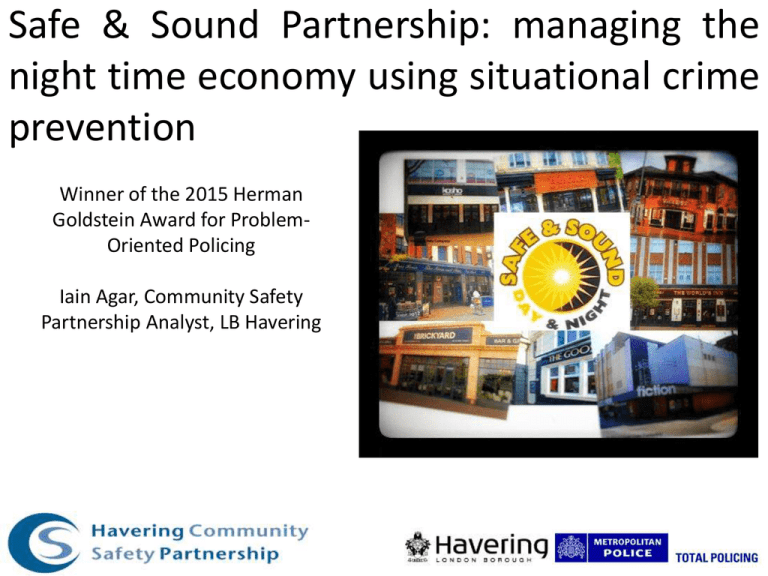
Safe & Sound Partnership: managing the night time economy using situational crime prevention Winner of the 2015 Herman Goldstein Award for ProblemOriented Policing Iain Agar, Community Safety Partnership Analyst, LB Havering London Borough of Havering • Havering is one of 32 boroughs that make up Greater London • Approx. 242,000 permanent residents over 43 square miles (23 square miles of protected green belt surrounds the urban area) • Most ethnically homogenous London borough (83% White British, compared to 55% for London) • Less deprived • Holds title of “Luckiest town” in the UK for number of National Lottery winners Scanning Scanning - Background • Urban Decline 1990’s Romford Town Centre (central business district) • Lack of amenities and reduced footfall after dark • High fear of crime after dark (perceived as a no-go area) • Romford Urban Strategy (1996-2006) • Relaxed Planning policies • Stimulated growth of late night venues Scanning – Background (cont.) • 41 restaurants, 21 bars/pubs and 4 nightclubs • Huge social and economic benefits • Romford key regional Metropolitan Centres • Key role in London’s night time economy (NTE) • 1.1m+ night time economy visitors annually (Fri/Sat) Scanning – New Challenges • Night time violence and disorder linked to burgeoning NTE • By 2009/10 Romford Town had: • Highest rate of 100,000 visitors centres violence per for regional • Highest volume of violence outside the West End • A 3-year increase of +27% for recorded violence Scanning – New Challenges (cont.) • A priority for the partnership • Negative media attention • 37% of residents thought drunk and rowdy behaviour was a problem • Just 55% of residents felt safe after dark Scanning – Impact • Disproportionate amount of violence occurring within NTE – the 80/20 rule • High socio-economic cost of £5.1m • Data triangulation highlights significant under-reporting to police • Impact on victims extends beyond the initial event (i.e. health) Outcome of assault patient data for those attending Accident & Emergency departments (ER) in Havering 2012-13 Analysis Analysis – Data sources • Victim / Offender / Location analysis • Data sources: • Metropolitan Police violence data • Ambulance & Hospital violence data • Officer & front line worker statements • Details of investigations reports • Academic Research Analysis – Background • 11-15,000 18-24 year olds each Fri/Sat Night • High proportion of “binge drinkers” • Intoxication = exposure to risk • Irresponsible drinks promotions Analysis – Victims • 18-29 year old males • 85% of victims had consumed alcohol • 58% could not remember the circumstances • Half of victims from outside Havering • Typically involving persons unknown to one another Analysis – Victims (cont.) Analysis – Offenders • 18-29 year old males • Suspects believed to be intoxicated • Police time dominated by prisoners in custody • Minimal risk of apprehension and punishment Analysis – Locations • Violence takes place predominantly in the street • An acute temporal pattern Analysis – Locations and crime script Analysis – Overview of specific problems Victims • Inadequate safeguards for intoxicated people • Higher cost and risk of injury from glass/bottles • Customers enter Romford already intoxicated (potential offenders also) Offenders • Activity was aimed towards detecting offences late rather than removing potential offenders (or victims) at an early stage • No fear of consequences of behaviour Locations • Unregulated space and street furniture leads to crowding • Closing times of venues mean large numbers leave together • Insufficient transport to remove people at the end of the night Response Response – Previous responses • Educating people about harmful drink levels – not immediate • Saturation policing - ineffective • Best Bar None – didn’t address issues outside Response – Safeguards against the intoxicated • Extending guardianship, removing vulnerable targets • Radio-link system • Safe Haven (Deeper lounge) (10pm-3am) • Street triage (10pm-4am) • Marshall taxi rank (10pm3:30am) Responses – risk of serious injury • Controlling tools and weapons • Toughened glass / polycarbonate glasses • Restrictions on times and locations of waste removal • Street Pastors securing discarded bottles brought into town Responses – addressing intoxication • Removing excuses • Mandatory licensing conditions • Banning drinks promotions • Raising minimum price • Local regeneration and highways policies • Licence required for advertising boards Responses - offenders • Removing excuses, denying benefits, reducing anonymity Responses - offenders • Controlling access, strengthened formal surveillance • CCTV • ScanNet/ClubScan Responses – locations • Prevention through design, increasing effort, reducing provocations, control access and screen exits • Reduction of street furniture and ‘clutter’ • Licensing (tables, chairs, outside space) Defensible Space Responses – locations • Control access and screen exits • Staggered closing times • Encouraging late licences Red – premises open until midnight 1am Blue – premises open until 1am-2am Green – premises open until 3am Purple – facilities open later than 4am Assessment Assessment - safeguards • Street Triage • 10 persons per month treated for injuries on site • 57% referred via radio-link from other frontline workers • 29% reduction in alcohol related ambulance call-outs since (274 down to 191) • Prevention of serious injury by glass/weapon • From 20 per year to average of 3 per year Assessment – removing offenders and consequences • 103 persons banned in first 12-months • Periods of 3-weeks to 5-years • Increase in offences with suspect (almost doubling to 70%) • Sanctioned detections increased from 36% to 55% (not incl. bans) • Dramatic reduction in victims not wishing to proceed (from 33% to 3%) Assessment – concentration of incidents Assessment – comparator data End Contact Details Iain Agar, Community Safety Partnership Analyst, IAIN.AGAR@havering.gov.uk
