Particle imaging technique for measuring the deformation rate of hydrogel microstructures
advertisement
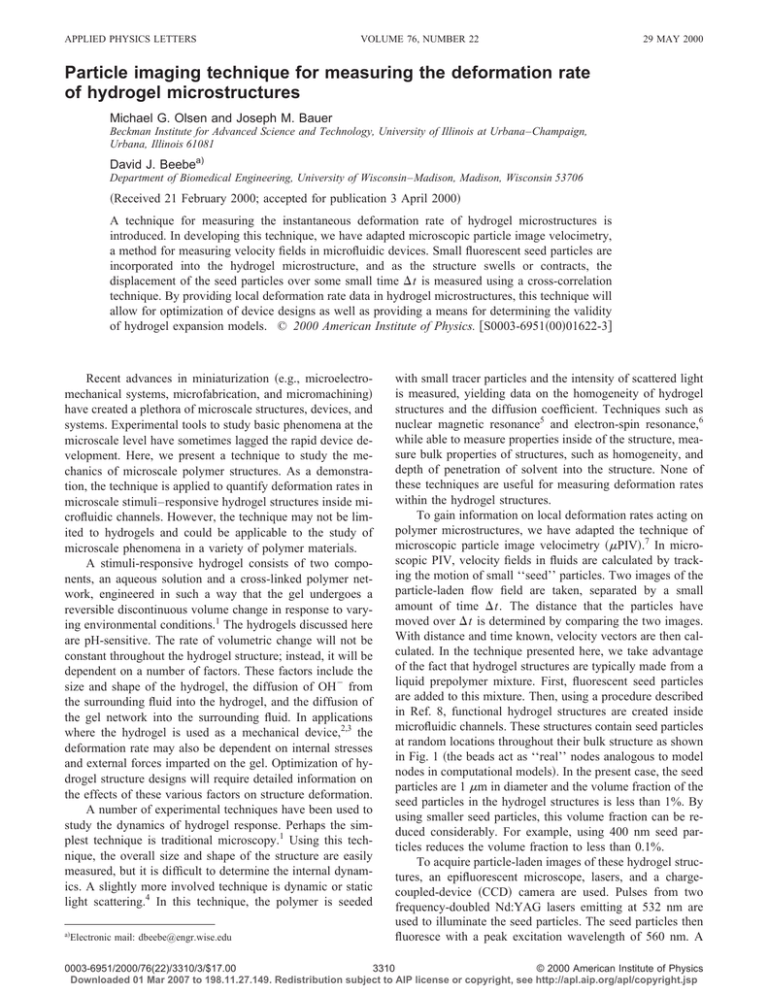
APPLIED PHYSICS LETTERS VOLUME 76, NUMBER 22 29 MAY 2000 Particle imaging technique for measuring the deformation rate of hydrogel microstructures Michael G. Olsen and Joseph M. Bauer Beckman Institute for Advanced Science and Technology, University of Illinois at Urbana–Champaign, Urbana, Illinois 61081 David J. Beebea) Department of Biomedical Engineering, University of Wisconsin–Madison, Madison, Wisconsin 53706 共Received 21 February 2000; accepted for publication 3 April 2000兲 A technique for measuring the instantaneous deformation rate of hydrogel microstructures is introduced. In developing this technique, we have adapted microscopic particle image velocimetry, a method for measuring velocity fields in microfluidic devices. Small fluorescent seed particles are incorporated into the hydrogel microstructure, and as the structure swells or contracts, the displacement of the seed particles over some small time ⌬t is measured using a cross-correlation technique. By providing local deformation rate data in hydrogel microstructures, this technique will allow for optimization of device designs as well as providing a means for determining the validity of hydrogel expansion models. © 2000 American Institute of Physics. 关S0003-6951共00兲01622-3兴 Recent advances in miniaturization 共e.g., microelectromechanical systems, microfabrication, and micromachining兲 have created a plethora of microscale structures, devices, and systems. Experimental tools to study basic phenomena at the microscale level have sometimes lagged the rapid device development. Here, we present a technique to study the mechanics of microscale polymer structures. As a demonstration, the technique is applied to quantify deformation rates in microscale stimuli–responsive hydrogel structures inside microfluidic channels. However, the technique may not be limited to hydrogels and could be applicable to the study of microscale phenomena in a variety of polymer materials. A stimuli-responsive hydrogel consists of two components, an aqueous solution and a cross-linked polymer network, engineered in such a way that the gel undergoes a reversible discontinuous volume change in response to varying environmental conditions.1 The hydrogels discussed here are pH-sensitive. The rate of volumetric change will not be constant throughout the hydrogel structure; instead, it will be dependent on a number of factors. These factors include the size and shape of the hydrogel, the diffusion of OH⫺ from the surrounding fluid into the hydrogel, and the diffusion of the gel network into the surrounding fluid. In applications where the hydrogel is used as a mechanical device,2,3 the deformation rate may also be dependent on internal stresses and external forces imparted on the gel. Optimization of hydrogel structure designs will require detailed information on the effects of these various factors on structure deformation. A number of experimental techniques have been used to study the dynamics of hydrogel response. Perhaps the simplest technique is traditional microscopy.1 Using this technique, the overall size and shape of the structure are easily measured, but it is difficult to determine the internal dynamics. A slightly more involved technique is dynamic or static light scattering.4 In this technique, the polymer is seeded a兲 Electronic mail: dbeebe@engr.wise.edu with small tracer particles and the intensity of scattered light is measured, yielding data on the homogeneity of hydrogel structures and the diffusion coefficient. Techniques such as nuclear magnetic resonance5 and electron-spin resonance,6 while able to measure properties inside of the structure, measure bulk properties of structures, such as homogeneity, and depth of penetration of solvent into the structure. None of these techniques are useful for measuring deformation rates within the hydrogel structures. To gain information on local deformation rates acting on polymer microstructures, we have adapted the technique of microscopic particle image velocimetry 共PIV兲.7 In microscopic PIV, velocity fields in fluids are calculated by tracking the motion of small ‘‘seed’’ particles. Two images of the particle-laden flow field are taken, separated by a small amount of time ⌬t. The distance that the particles have moved over ⌬t is determined by comparing the two images. With distance and time known, velocity vectors are then calculated. In the technique presented here, we take advantage of the fact that hydrogel structures are typically made from a liquid prepolymer mixture. First, fluorescent seed particles are added to this mixture. Then, using a procedure described in Ref. 8, functional hydrogel structures are created inside microfluidic channels. These structures contain seed particles at random locations throughout their bulk structure as shown in Fig. 1 共the beads act as ‘‘real’’ nodes analogous to model nodes in computational models兲. In the present case, the seed particles are 1 m in diameter and the volume fraction of the seed particles in the hydrogel structures is less than 1%. By using smaller seed particles, this volume fraction can be reduced considerably. For example, using 400 nm seed particles reduces the volume fraction to less than 0.1%. To acquire particle-laden images of these hydrogel structures, an epifluorescent microscope, lasers, and a chargecoupled-device 共CCD兲 camera are used. Pulses from two frequency-doubled Nd:YAG lasers emitting at 532 nm are used to illuminate the seed particles. The seed particles then fluoresce with a peak excitation wavelength of 560 nm. A 0003-6951/2000/76(22)/3310/3/$17.00 3310 © 2000 American Institute of Physics Downloaded 01 Mar 2007 to 198.11.27.149. Redistribution subject to AIP license or copyright, see http://apl.aip.org/apl/copyright.jsp Appl. Phys. Lett., Vol. 76, No. 22, 29 May 2000 Olsen, Bauer, and Beebe 3311 FIG. 1. Schematic of the hydrogel structure containing 1-m-diam fluorescent seed particles. The shaded region signifies the depth of the measurement volume. filter cube in the microscope removes the illuminating light such that only the emitted light from the particles reaches the CCD camera. The resulting images are then recorded digitally on a computer. Two images showing the seed particle locations at different times are then analyzed, yielding the motion of the particles between two laser pulses. To calculate the velocity vectors, the images are first divided into a number of small regions called interrogation spots. Using a cross-correlation technique,9 the average velocity of the particles within each of the interrogation spots is calculated, yielding a regular grid of velocity vectors. Because the microscope has a fixed depth of focus, only particles within a certain volume will produce images on the CCD camera.10 The success of this technique in determining vectors depends on the number of particles within this interrogation volume. If too few particles are present, it becomes difficult to differentiate the signal peak containing the velocity data from random noise in the correlation plane. Typically, 3–5 particles must be present in an interrogation volume for the correlation technique to be successful. The size of the interrogation spots must be chosen such that they meet this criterion. Even in the most carefully designed experiment, a small number of erroneous vectors will be calculated, but these can be easily removed. This can be done by a number of methods, such as comparing the measured vector to its neighbors or by removing any vectors which differ from the mean deformation rate by more than a specified number of standard deviations. The interrogation volume used for the results presented here measures 30 m ⫻30 m⫻38 m. Each measured deformation vector corresponds to the mean displacement within a volume of this size. In the experiments performed here, the deformation of the hydrogel is axisymmetric, and thus integrating over this 38 m depth is acceptable. However, in other applications, integrating measurements over such a depth may be undesirable. In these applications, using a higher numerical aperture objective will result in an interrogation volume with a smaller depth, thus allowing for greater spatial resolution. In the experiments performed here, the hydrogel is initially in an acidic environment (pH⫽3.0). At these conditions, the gel is in its contracted state. At time t⫽0, the pH was changed to 12.0, and the hydrogel began to expand. The previously described technique was used to measure the deformation rate of the expanding hydrogel at various later times. For this set of experiments, ⌬t was chosen to be 1 s. In comparison, the overall expansion time of the hydrogel structure was 10 min. Figure 2 shows the measured deformation vectors at t⫽19 s, t⫽35 s, and t⫽50 s. The magnitudes FIG. 2. Actual hydrogel images with calculated vectors superimposed. The hydrogel is a cylindrical shape that is in contact with the top and bottom of a 200-m-deep glass channel. The volume fraction 共bead-to-gel volume兲 is less than 1%. The focal plane and calculated vectors are in the approximate middle of the structure 共i.e., approximately 100 m from the bottom of the channel兲. The diameter of the structure immediately after polymerization was 400 m. 共a兲 19 s after exposure to a pH solution that induces swelling; 共b兲 elapsed time of 35 s; and 共c兲 elapsed time of 50 s. The scale bar is 200 m and the scale vector corresponds to 15 m/s. of the deformation vectors as a function of position at the three different times are shown in Fig. 3. Figure 4 shows expansion rates as a function of radial position at various times for a single slice through the diameter of the hydrogel structure. At t⫽19 s, the mean-deformation rate within the reacted region is 4.7 m/s. At t⫽35 s and t⫽50 s, this mean-deformation rate drops to 4.5 and 2.9 /s, respectively. The uncertainty in the deformation rate measurements depends on the accuracy to which the signal peak in the correlation plane can be located to subpixel resolution. This subpixel uncertainty has been found to be less than ⫾0.2 pixels.11 For the measurements presented here, this corresponds to an experimental uncertainty of less than 4%. This uncertainty can be reduced by increasing ⌬t, and thus in- Downloaded 01 Mar 2007 to 198.11.27.149. Redistribution subject to AIP license or copyright, see http://apl.aip.org/apl/copyright.jsp 3312 Appl. Phys. Lett., Vol. 76, No. 22, 29 May 2000 Olsen, Bauer, and Beebe FIG. 4. Velocity magnitude vs x pixel position. These magnitudes were taken at constant y(y⫽497) from the 3D plots in Fig. 3. FIG. 3. Three-dimensional 共3D兲 contour plot of vector magnitude vs 共x,y兲 pixel position of the images shown in Fig. 2. 共a兲 Elapsed time of 19 s; 共b兲 elapsed time of 35 s; and 共c兲 elapsed time of 50 s. creasing the integer pixel displacement of the correlation peak, consequently reducing the contribution of subpixel error to the uncertainty. The data included in Figs. 2–4 demonstrate the strength of this experimental technique, namely, that it allows for visualization and quantification of the processes occurring within the hydrogel. For example, as the hydrogel expands, the interface between the swollen and unswollen regions can clearly be seen. In addition, with this analysis tool, it is possible to quantify not only the overall size and shape of the hydrogel, but also to determine which regions of the gel are expanding at a given time, and the rate at which those portions are expanding. This information is needed to determine the optimum design parameters that will produce fast and efficient hydrogel microvalves and microactuators. For example, it is apparent from Figs. 2–4 that the most drastic and rapid response to stimuli occurs in the outermost region of the structure. The internal region of the structure reacts more slowly and could possibly be removed or replaced with an inert material with little loss of function. Similarly, designs of other hydrogel structures and geometries could be opti- mized by determining which regions are contributing to the desired function, and which regions need to be redesigned. In addition, the quantitative data from this technique may be used to verify the validity of existing hydrogel expansion and contraction models or lead to the development of refined theories regarding hydrogel response. It may also lead to more accurate determinations of hydrogel properties such as bulk modulus by measuring the response of hydrogels under load. Although this technique has been demonstrated for a pH-responsive hydrogel, its application is not limited only to this class of materials. It can also be applied to hydrogels engineered to respond to other external stimuli, such as temperature, light, etc. In addition, this technique could possibly be used on other transparent materials utilized in the construction of microscale devices, such as polydimethylsiloxane and polymethylmethacyrlate. This technique is potentially applicable to any material that is transparent to light in some region of the visible, near-infared, or near-ultraviolet spectrum, and also would not have its mechanical properties significantly affected by the presence of the small seed particles. In such a material, this technique will allow deformation rates to be determined, leading to more intelligent device designs. This work was supported under a grant from DARPA– MTO 共F33615-98-1-2853兲, under program manager Dr. Abraham Lee. 1 T. Tanaka, D. Filmore, S.-T. Sun, I. Nishio, G. Swislow, and A. Shah, Phys. Rev. Lett. 45, 1636 共1980兲. 2 J. Constance, J. Mech. Eng. 113, 51 共1991兲. 3 S. Geherke, G. Andrews, and E. Cussler, Chem. Eng. Sci. 41, 2153 共1986兲. 4 T. Tanaka, E. Sato, Y. Hirokawa, S. Hirotsu, and J. Peetermans, Phys. Rev. Lett. 55, 2455 共1985兲. 5 T. Ikehara, T. Nishi, and T. Hayashi, Polym. J. 共Tokyo兲 28, 169 共1996兲. 6 S. Schlick, J. Pilar, S.-C. Kweon, J. Vacik, Z. Gao, and J. Labsky, Macromolecules 28, 5780 共1995兲. 7 J. Santiago, S. Wereley, C. Meinhart, D. Beebe, and R. Adrian, Exp. Fluids 25, 316 共1998兲. 8 D. Beebe, J. Moore, J. Bauer, Q. Yu, R. Liu, C. Devadoss, and B.-H. Jo, Nature 共London兲 404, 588 共2000兲. 9 R. Keane and R. Adrian, Appl. Sci. Res. 49, 191 共1992兲. 10 M. Olsen and R. Adrian, Exp. Fluids 共to be published兲. 11 A. Prasad, R. Adrian, C. Landreth, and P. Offutt, Exp. Fluids 13, 105 共1992兲. Downloaded 01 Mar 2007 to 198.11.27.149. Redistribution subject to AIP license or copyright, see http://apl.aip.org/apl/copyright.jsp

