Automatic Detection of CME Leading Edges Christina Burns Mentor: Tim Howard Background
advertisement
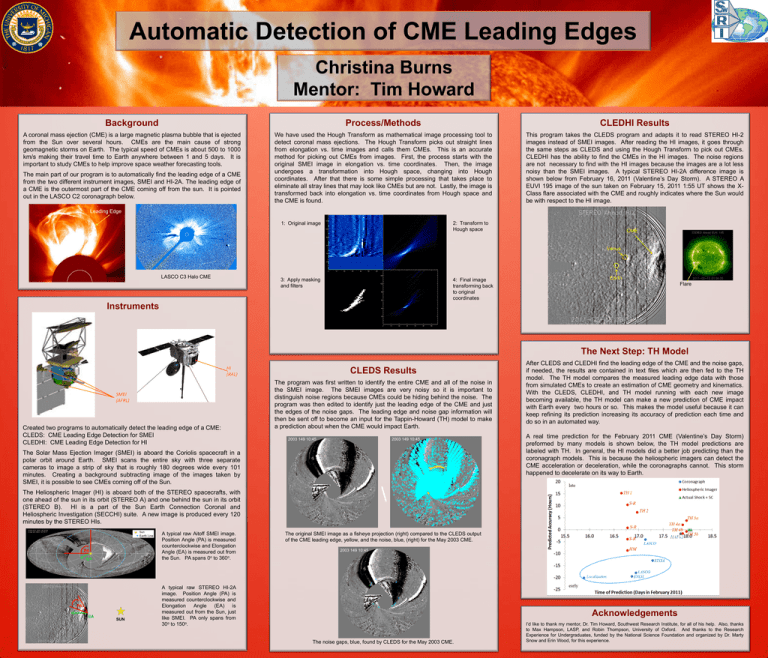
Automatic Detection of CME Leading Edges Christina Burns Mentor: Tim Howard Background Process/Methods CLEDHI Results A coronal mass ejection (CME) is a large magnetic plasma bubble that is ejected from the Sun over several hours. CMEs are the main cause of strong geomagnetic storms on Earth. The typical speed of CMEs is about 500 to 1000 km/s making their travel time to Earth anywhere between 1 and 5 days. It is important to study CMEs to help improve space weather forecasting tools. We have used the Hough Transform as mathematical image processing tool to detect coronal mass ejections. The Hough Transform picks out straight lines from elongation vs. time images and calls them CMEs. This is an accurate method for picking out CMEs from images. First, the process starts with the original SMEI image in elongation vs. time coordinates. Then, the image undergoes a transformation into Hough space, changing into Hough coordinates. After that there is some simple processing that takes place to eliminate all stray lines that may look like CMEs but are not. Lastly, the image is transformed back into elongation vs. time coordinates from Hough space and the CME is found. This program takes the CLEDS program and adapts it to read STEREO HI-2 images instead of SMEI images. After reading the HI images, it goes through the same steps as CLEDS and using the Hough Transform to pick out CMEs. CLEDHI has the ability to find the CMEs in the HI images. The noise regions are not necessary to find with the HI images because the images are a lot less noisy than the SMEI images. A typical STEREO HI-2A difference image is shown below from February 16, 2011 (Valentine’s Day Storm). A STEREO A EUVI 195 image of the sun taken on February 15, 2011 1:55 UT shows the XClass flare associated with the CME and roughly indicates where the Sun would be with respect to the HI image. The main part of our program is to automatically find the leading edge of a CME from the two different instrument images, SMEI and HI-2A. The leading edge of a CME is the outermost part of the CME coming off from the sun. It is pointed out in the LASCO C2 coronagraph below. Leading Edge 2: Transform to Hough space 1: Original image CME Venus LASCO C3 Halo CME 3: Apply masking and filters 4: Final image transforming back to original coordinates Earth Flare Instruments The Next Step: TH Model HI (RAL) SMEI (AFRL) Created two programs to automatically detect the leading edge of a CME: CLEDS: CME Leading Edge Detection for SMEI CLEDHI: CME Leading Edge Detection for HI CLEDS Results The program was first written to identify the entire CME and all of the noise in the SMEI image. The SMEI images are very noisy so it is important to distinguish noise regions because CMEs could be hiding behind the noise. The program was then edited to identify just the leading edge of the CME and just the edges of the noise gaps. The leading edge and noise gap information will then be sent off to become an input for the Tappin-Howard (TH) model to make a prediction about when the CME would impact Earth. 2003 149 10:45 2003 149 10:45 The Solar Mass Ejection Imager (SMEI) is aboard the Coriolis spacecraft in a polar orbit around Earth. SMEI scans the entire sky with three separate cameras to image a strip of sky that is roughly 180 degrees wide every 101 minutes. Creating a background subtracting image of the images taken by SMEI, it is possible to see CMEs coming off of the Sun. Earth Line PA EA PA EA SUN A typical raw Aitoff SMEI image. Position Angle (PA) is measured counterclockwise and Elongation Angle (EA) is measured out from the Sun. PA spans 0o to 360o. A real time prediction for the February 2011 CME (Valentine’s Day Storm) preformed by many models is shown below, the TH model predictions are labeled with TH. In general, the HI models did a better job predicting than the coronagraph models. This is because the heliospheric imagers can detect the CME acceleration or deceleration, while the coronagraphs cannot. This storm happened to decelerate on its way to Earth. \ The Heliospheric Imager (HI) is aboard both of the STEREO spacecrafts, with one ahead of the sun in its orbit (STEREO A) and one behind the sun in its orbit (STEREO B). HI is a part of the Sun Earth Connection Coronal and Heliospheric Investigation (SECCHI) suite. A new image is produced every 120 minutes by the STEREO HIs. Sun After CLEDS and CLEDHI find the leading edge of the CME and the noise gaps, if needed, the results are contained in text files which are then fed to the TH model. The TH model compares the measured leading edge data with those from simulated CMEs to create an estimation of CME geometry and kinematics. With the CLEDS, CLEDHI, and TH model running with each new image becoming available, the TH model can make a new prediction of CME impact with Earth every two hours or so. This makes the model useful because it can keep refining its prediction increasing its accuracy of prediction each time and do so in an automated way. The original SMEI image as a fisheye projection (right) compared to the CLEDS output of the CME leading edge, yellow, and the noise, blue, (right) for the May 2003 CME. 2003 149 10:45 A typical raw STEREO HI-2A image. Position Angle (PA) is measured counterclockwise and Elongation Angle (EA) is measured out from the Sun, just like SMEI. PA only spans from 30o to 150o. Acknowledgements The noise gaps, blue, found by CLEDS for the May 2003 CME. I’d like to thank my mentor, Dr. Tim Howard, Southwest Research Institute, for all of his help. Also, thanks to Max Hampson, LASP, and Robin Thompson, University of Oxford. And thanks to the Research Experience for Undergraduates, funded by the National Science Foundation and organized by Dr. Marty Snow and Erin Wood, for this experience.
