Sub-band Filtering for MR Texture Segmentation
advertisement

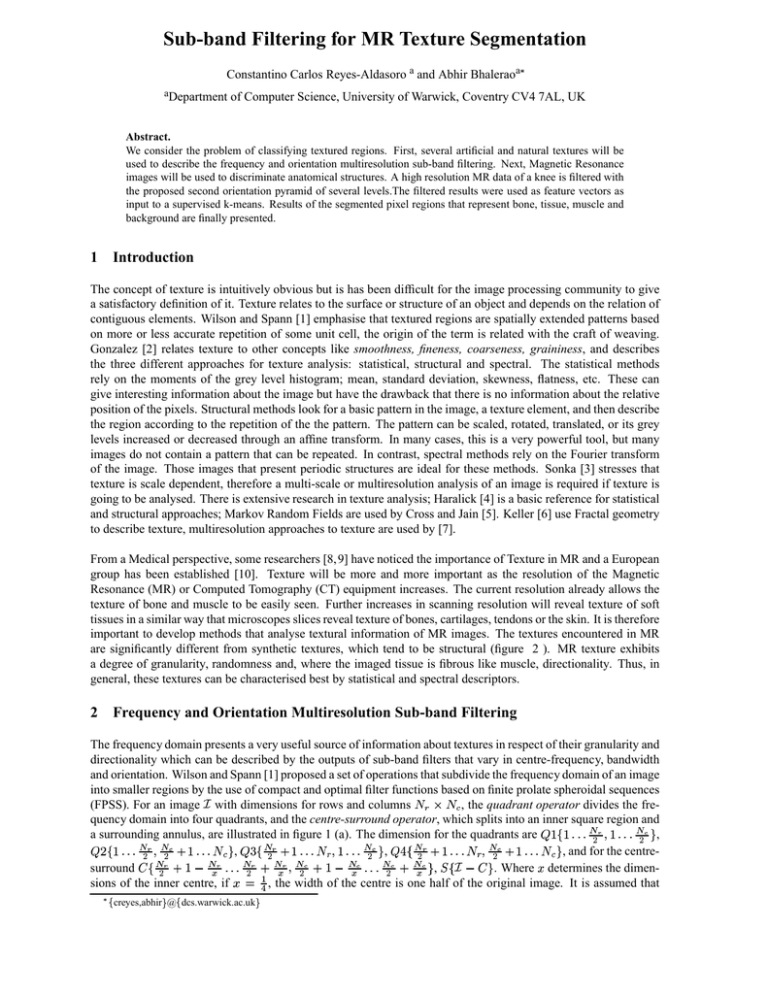
Sub-band Filtering for MR Texture Segmentation Constantino Carlos Reyes-Aldasoro a and Abhir Bhaleraoa aDepartment of Computer Science, University of Warwick, Coventry CV4 7AL, UK Abstract. We consider the problem of classifying textured regions. First, several artificial and natural textures will be used to describe the frequency and orientation multiresolution sub-band filtering. Next, Magnetic Resonance images will be used to discriminate anatomical structures. A high resolution MR data of a knee is filtered with the proposed second orientation pyramid of several levels.The filtered results were used as feature vectors as input to a supervised k-means. Results of the segmented pixel regions that represent bone, tissue, muscle and background are finally presented. 1 Introduction The concept of texture is intuitively obvious but is has been difficult for the image processing community to give a satisfactory definition of it. Texture relates to the surface or structure of an object and depends on the relation of contiguous elements. Wilson and Spann [1] emphasise that textured regions are spatially extended patterns based on more or less accurate repetition of some unit cell, the origin of the term is related with the craft of weaving. Gonzalez [2] relates texture to other concepts like smoothness, fineness, coarseness, graininess, and describes the three different approaches for texture analysis: statistical, structural and spectral. The statistical methods rely on the moments of the grey level histogram; mean, standard deviation, skewness, flatness, etc. These can give interesting information about the image but have the drawback that there is no information about the relative position of the pixels. Structural methods look for a basic pattern in the image, a texture element, and then describe the region according to the repetition of the the pattern. The pattern can be scaled, rotated, translated, or its grey levels increased or decreased through an affine transform. In many cases, this is a very powerful tool, but many images do not contain a pattern that can be repeated. In contrast, spectral methods rely on the Fourier transform of the image. Those images that present periodic structures are ideal for these methods. Sonka [3] stresses that texture is scale dependent, therefore a multi-scale or multiresolution analysis of an image is required if texture is going to be analysed. There is extensive research in texture analysis; Haralick [4] is a basic reference for statistical and structural approaches; Markov Random Fields are used by Cross and Jain [5]. Keller [6] use Fractal geometry to describe texture, multiresolution approaches to texture are used by [7]. From a Medical perspective, some researchers [8,9] have noticed the importance of Texture in MR and a European group has been established [10]. Texture will be more and more important as the resolution of the Magnetic Resonance (MR) or Computed Tomography (CT) equipment increases. The current resolution already allows the texture of bone and muscle to be easily seen. Further increases in scanning resolution will reveal texture of soft tissues in a similar way that microscopes slices reveal texture of bones, cartilages, tendons or the skin. It is therefore important to develop methods that analyse textural information of MR images. The textures encountered in MR are significantly different from synthetic textures, which tend to be structural (figure 2 ). MR texture exhibits a degree of granularity, randomness and, where the imaged tissue is fibrous like muscle, directionality. Thus, in general, these textures can be characterised best by statistical and spectral descriptors. 2 Frequency and Orientation Multiresolution Sub-band Filtering The frequency domain presents a very useful source of information about textures in respect of their granularity and directionality which can be described by the outputs of sub-band filters that vary in centre-frequency, bandwidth and orientation. Wilson and Spann [1] proposed a set of operations that subdivide the frequency domain of an image into smaller regions by the use of compact and optimal filter functions based on finite prolate spheroidal sequences (FPSS). For an image with dimensions for rows and columns , the quadrant operator divides the frequency domain into four quadrants, and the centre-surround operator, which splits into an inner square region and a surrounding annulus, are illustrated in figure 1 (a). The dimension for the quadrants are , , , , and for the centresurround , . Where determines the dimensions of the inner centre, if , the width of the centre is one half of the original image. It is assumed that ! "# %$ &' # ( %)* + " #, - "# . & 0/ &1 & 1 0 / 1 ( ( 1 23 /!. 4 465897 :<; creyes,abhir= @; dcs.warwick.ac.uk= KJKJKJ KJKJKJ KJKJKJ KJKJKJ KJKJKJ KJKJKJ KJKJKJ KJKJKJ KJKJKJ KJKJKJ KJKJKJ KJKJKJ KJKJKJ KJKJKJ KJKJKJ KJKJKJ KJKJKJ KJKJKJ KJKJKJ KJKJKJ KJJKKJ JKJKKJ JKJKKJ JKJKKJ JKJKKJ JKJKKJ JKJKKJ JKJKKJ JKJKKJ KJJKKJ KJKJ KJKJ KJKJ KJKJ KJKJ KJKJ KJKJ KJKJ KJKJ KJKJ G A HIIHIH HIIHIH HIIHIH HIIHIH HIIHIH HIIHIH HIIHIH HIIHIH HIIHIH HIIHIH QPQPPQ QPQPPQ QPQPPQ QPQPPQ QPQPPQ IHIHIH IHIHIH IHIHIH IHIHIH IHIHIH IHIHIH IHIHIH IHIHIH IHIHIH IHIHIH QPQPQP QPQPQP QPQPQP QPQPQP QPQPQP IHIHIH IHIHIH IHIHIH IHIHIH IHIHIH IHIHIH IHIHIH IHIHIH IHIHIH IHIHIH HIH HIH HIH HIH HIH HIH HIH HIH HIH IHH >@? >FI E I I I I I I I I >CID >CB SRSRSR SRSRSR SRSRSR SRSRSR SRSRSR UTUTUT UTUTUT UTUTUT UTUTUT UTUTUT ONONON ONONON ONONON ONONON ONOONN LLL MLMMLL MLMMLL MLMMLL MLMMLL MLMMLL SRSR SRSR SRSR SRSR SRSR UTUT UTUT UTUT UTUT UTUT ONON ONON ONON ONON ONON LL MLML MLML MLML MLML MLML (a) 3 5 4 10 2 11 12 17 18 19 20 9 ... 16 21 6 13 7 14 15 8 1 V For a given image : 1. Fourier Transform the image: 2. Filter the transformed image with a window function: a truncated Gaussian with height at the window edge at the region: 3. Inverse Fourier transform each filtered product: V*WX-Y%Z[V\ ^] _0`badc V*W*ef Ygh]iZ[V W e f \ (b) (c) Figure 1. (a) Primitive tessellation operators. (b) Second orientation pyramid of level 3 (c) Algorithm to obtain the features used for classification. (a) (b) (c) Figure 2. Three different textured images: (a) Artificial textures (b) Collection of different natural and synthetic textures, and (c) A human knee MRI . ,,5jk l5mn so that the results of the divisions are always integer values. Diverse combinations and order of the operators can yield different tessellations, including the well known Gaussian and Laplacian pyramids. The decomposition also bears similarities to a complex Wavelet transform [11] and Gabor Filters [12]. For this work, the second orientation pyramid presented in figure 1(b) was selected for the tessellation of the frequency domain. The steps used to obtain a set of texture features at each spatial coordinate are described in figure 1(c). Each region of the tessellation yields one feature component image which will be then used by the k-means classifier. 3 Segmentation Results Three different textural images were considered for these paper. First, a combination of artificial textures: random Gaussian noise with different means and variances and oriented patterns result of filtered impulse noise with different orientation and frequencies are shown in figure 2(a). Second, a set of 16 different natural and synthetic textures from [13] (figure 2(b)). And third, a MR image of a human knee (figure 2(c)). This last image is of particular interest, and the segmentation will focus on four regions, namely, background, muscle, bone and tissue. The sub-band filtering algorithm was applied for the three test images. Each of the sub-band filtering results will be used as a feature for the k-means classification. Figure 3 (a) shows the first two levels of the second orientation pyramid for the artificial textures. Each individual image contains the same number of pixels as the original image, and they are placed according to figure 1 (b) in position and size. It can be observed the high pass (outer figures) nature in all orientations (regions 2 to 7) of the random noise regions while the oriented patterns concentrate the energy in only some regions, mainly of lower frequencies. This is particularly notorious in regions 11 and 12 (middle figures). Region 8 (central figure) is a low pass filtered version of . In figure 3 (b) the first two levels for the human knee MRI are presented. Again, the high frequency regions 2, 3, 6 and 7 are dominated by noise-like patterns, which in this case correspond to the background of the image. The other regions of high frequency, have their higher intensities equally in bone, tissue and muscle, and partly characterise their texture. Figure 4 presents the segmentation results from figure 2 (a) and (b). Figure 4 (a) shows the segmentation using the features of the first level of the pyramid, regions 1 to 7. It is clear that the segmentation is not very good as the oriented patterns are registered as a combination of classes. When four levels of the pyramid are used, this problem is overcome and 3 4 10 2 5 11 12 9 6 13 14 7 15 (a) 3 4 10 2 (b) 5 11 9 12 6 13 14 7 15 Figure 3. Sub-band filter images of the second orientation pyramid containing 13 sub-band regions, (a) of the artificial textures and (b) of the human knee MRI. the four regions are clearly defined (Figure 4 b). The composite image of 16 natural and synthetic textures (Figure 4 c) was segmented using 6 levels of the pyramid. The segmentation results presented show a varied degree of separability for different textures. The lower left hand corner has a mixture of textures, yet the rest of the image is fairly well discriminated. The most interesting image is the human knee MRI in which the three anatomical regions of muscle, bone, tissue and the background of the image were to be segmented. To determine the average values for the k-means algorithm, hand segmented regions were considered as initial conditions and later used to measure misclassification. Figure 5 (a) show the segmentation obtained with the features of the first level of the pyramid with the misclassification rate. Clearly, there are not enough features to clearly distinguish bone and tissue, yet fine details like the cartilage between femur and infrapatellar pad are visible. Figure 5 (b) presents the result for the third level of the pyramid, as the number of features increases, the regions become uniform and smooth. Now the femur and the tibia are distinguished from the tissue, the background and the muscle are also correctly classified. Figure 5 (c) presents the classification of a neighbouring slice (number 60) of an MRI set using the same level of the pyramid but with the k-means seeded with the means of the previous slice (number 54). Background, muscle, bone and tissue have been segmented. 4 Conclusions A sub-band Filtering algorithm for segmentation of MR images was proposed. The method was described and tested, first, with artificial and natural textures yielding fairly good results. The algorithm was then used to segment a human knee MRI. The anatomical regions: muscle, bone and tissue, and the background could be distinguished. The method was validated in a neighbouring slice of which no initial values were taken and the regions were also properly classified. Sophisticated classifiers that incorporate context such as a local Markov model of pixel classes (a) (b) (c) Figure 4. K-means classification of (a) the artificial textures with the features of the first level of the pyramid, (b) the artificial textures with fourth level of the pyramid and (c) natural and synthetic textures with sixth level of the pyramid. (a) (b) (c) Figure 5. K-means classification of MR image of a human knee based on frequency and orientation regions from (a) First level of the second orientation pyramid, misclassification 24.26% (b) Third level of the pyramid, misclassification 17.05% (c) Third level of the pyramid for a neighbouring MRI slice with the initial values of (b). and a posterior maximisation, or a non-parametric approach using quad-tree clustering will improve the results over k-means. Ultimately, our aim is to incorporate such textural descriptors into a cooperative boundary/region segmentation framework that also exploits local structure estimation. References 1. R. Wilson & M. Spann. Image Segmentation and Uncertainty. John Wiley and Sons Inc., New York, 1988. 2. R. C. Gonzalez & R. E. Woods. Digital Image Processing. Addison Wesley, Reading Mass, second edition, 1992. 3. M. Sonka, V. Hlavac & R. Boyle. Image Processing, Analysis and Machine Vision. PWS, Pacific Grove, USA, second ed. edition, 1998. 4. R. M. Haralick. “Statistical and structural approaches to texture.” Proceedings of the IEEE 67(5), pp. 786–804, 1979. 5. G. R. Cross & A. K. Jain. “Markov Random Field Texture Models.” IEEE Transactions on Pattern Analysis and Machine Intelligence PAMI-5(1), pp. 25–39, 1983. 6. J. M. Keller & S. Chen. “Texture Description and Segmentation through Fractal Geometry.” Computer Vision, Graphics and Image Processing 45, pp. 150–166, 1989. 7. M. Unser & M. Eden. “Multiresolution Feature Extraction and Selection for Texture Segmentation.” IEEE Transactions on Pattern Analysis and Machine Intelligence 11(7), pp. 717–728, 1989. 8. R. A. Lerski, K. Straughan & L. R. Schad. “MR Image Texture Analysis - An approach to Tissue Characterisation.” Magnetic Resonance Imaging 11, pp. 873–887, 1993. 9. L. R. Schad, S. Bluml & I. Zuna. “MR Tissue Characterization of Intracrianal Tumors by means of Texture Analysis.” Magnetic Resonance Imaging 11, pp. 889–896, 1993. 10. C. E. C. in the field of Scientific & T. REsearch. COST B11 Quantitation of Magnetic Resonance Image Texture. World Wide Web, http://www.uib.no/costb11/, 2002. 11. M. Unser. “Texture Classification and Segmentation Using Wavelet Frames.” IEEE Transactions on Image Processing 4(11), pp. 1549–1560, 1995. 12. A. K. Jain & F. Farrokhinia. “Unsupervised texture segmentation using Gabor filters.” Pattern Recognition 23(12), pp. 1167–1186, 1991. 13. T. Randen & J. H. Hus y. “Filtering for texture classification: A comparative study.” IEEE T-PAMI 21(4), pp. 291–310, 1999. o


