3-32 obtained using Property Plot feature of EES.
advertisement
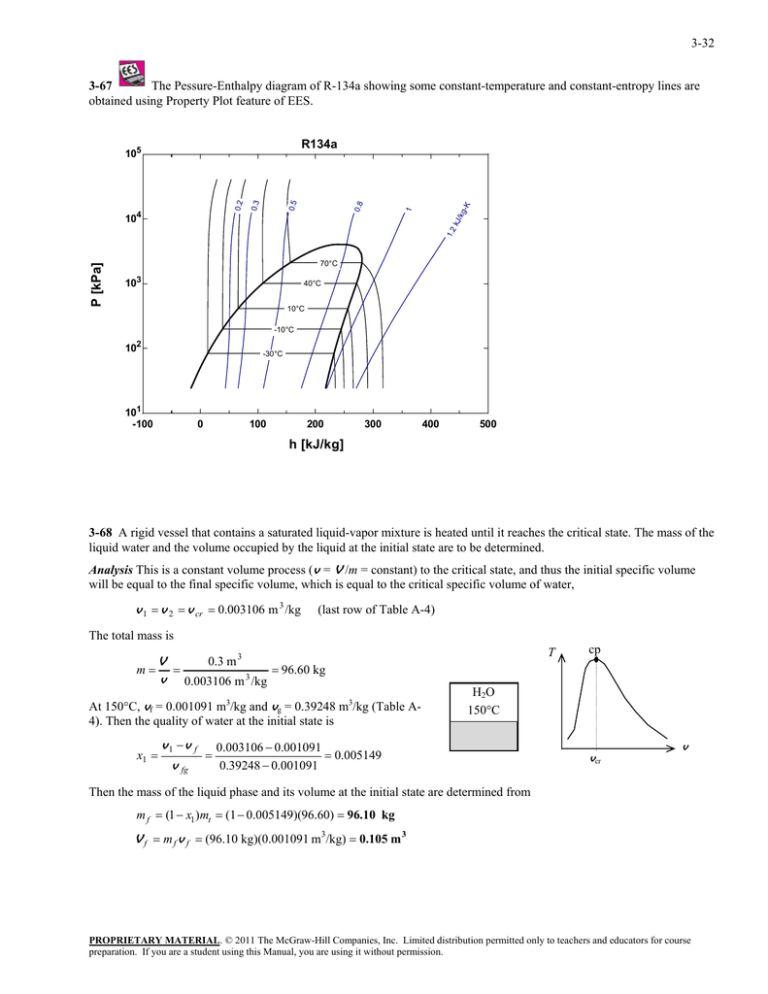
3-32 3-67 The Pessure-Enthalpy diagram of R-134a showing some constant-temperature and constant-entropy lines are obtained using Property Plot feature of EES. P [kPa] 1.2 kJ /k g 1 0.8 0.5 0.3 0.2 104 -K R134a 105 70°C 103 40°C 10°C -10°C 102 -30°C 101 -100 0 100 200 300 400 500 h [kJ/kg] 3-68 A rigid vessel that contains a saturated liquid-vapor mixture is heated until it reaches the critical state. The mass of the liquid water and the volume occupied by the liquid at the initial state are to be determined. Analysis This is a constant volume process (v = V /m = constant) to the critical state, and thus the initial specific volume will be equal to the final specific volume, which is equal to the critical specific volume of water, v 1 v 2 v cr 0.003106 m 3 /kg (last row of Table A-4) The total mass is 0.3 m 3 V m 96.60 kg v 0.003106 m 3 /kg At 150°C, vf = 0.001091 m3/kg and vg = 0.39248 m3/kg (Table A4). Then the quality of water at the initial state is x1 v1 v f v fg T cp H2O 150C 0.003106 0.001091 0.005149 0.39248 0.001091 vcr v Then the mass of the liquid phase and its volume at the initial state are determined from m f (1 x1 )mt (1 0.005149)(96.60) 96.10 kg V f m f v f (96.10 kg)(0.001091 m3/kg) 0.105 m 3 PROPRIETARY MATERIAL. © 2011 The McGraw-Hill Companies, Inc. Limited distribution permitted only to teachers and educators for course preparation. If you are a student using this Manual, you are using it without permission.

