Aboriginal and Torres Strait Islander – Queensland population
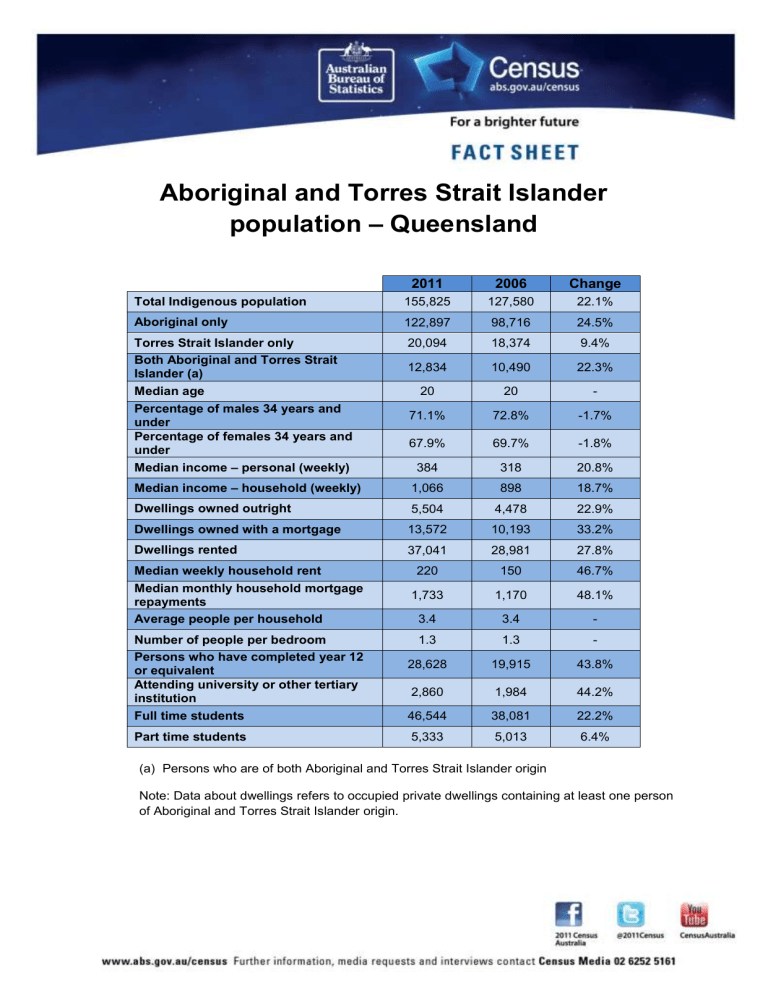
Aboriginal and Torres Strait Islander population – Queensland
Total Indigenous population
2011
155,825
2006
127,580
Aboriginal only
Torres Strait Islander only
Both Aboriginal and Torres Strait
Islander (a)
Median age
Percentage of males 34 years and under
Percentage of females 34 years and under
Median income – personal (weekly)
Median income – household (weekly)
Dwellings owned outright
Dwellings owned with a mortgage
122,897
20,094
12,834
20
71.1%
67.9%
384
1,066
5,504
13,572
98,716
18,374
10,490
20
72.8%
69.7%
318
898
4,478
10,193
Dwellings rented
Median weekly household rent
Median monthly household mortgage repayments
Average people per household
Number of people per bedroom
Persons who have completed year 12 or equivalent
Attending university or other tertiary institution
Full time students
37,041
220
1,733
3.4
1.3
28,628
2,860
28,981
150
1,170
3.4
1.3
19,915
1,984
46,544 38,081
Part time students 5,333 5,013
(a) Persons who are of both Aboriginal and Torres Strait Islander origin
Change
22.1%
24.5%
9.4%
22.3%
-
-1.7%
-1.8%
20.8%
18.7%
22.9%
33.2%
27.8%
46.7%
48.1%
-
-
43.8%
44.2%
22.2%
6.4%
Note: Data about dwellings refers to occupied private dwellings containing at least one person of Aboriginal and Torres Strait Islander origin.
